


The classic definition of machine learning says, how you learn from your experience and apply that learning for future prediction, with that being told it is a little confusing to understand unsupervised learning. So when you are dealing with unsupervised learning there is no Target variable. You can not calculate your model’s accuracy/performance, so how will you improve or how will you judge your learning.
So, when you start looking at the actual application of unsupervised learning you realize its true potential.
Imagine you are a part of a Data Science Team and your goal is to suggest a scheme or offer for a credit card holders for a bank, or suggest movies for an OTT platform subscriber in these type of problem where you are taking a new step for the first time, you don’t have any experience but just based on the Hidden Pattern in your Data you are about to take some action, this is what is the main power of Unsupervised learning is.
So Unsupervised learning is a Prerequisite in Supervised learning.
Types of Unsupervised Learning:
The most Unsupervised learning we see are-
· K means Clustering
· Hierarchical Clustering
· Recommendation Systems
Here we will briefly discuss Clustering techniques and the ideas behind them. More on the Recommendation system later.
K means:
The idea of K means is that, you cluster points based on the distance between them and then you can assume that points belonging to the same cluster will have similar characteristics. In easy words, you can say it is like grouping based on centroids of clusters. Now how those clusters are formed is a very interesting concept on its own.
K Means clustering works on the principle of Expectation-Maximization. It is a two-step process.
Imagine you have a huge distribution of Data Points. Our goal is to find k clusters in the distribution where each point of the cluster is closest to its cluster center than any other cluster’s center. This step can not be achieved at once(it is one of the reasons that Clustering takes time for a huge Dataset).
First, we will randomly choose k points in our distribution and then based on them assign each point to a particular cluster based on the distance between the points, this way we will form an initial cluster. Now when we have made an initial cluster, we will adjust the center of this cluster to the centroid position of the cluster, after this, we will again assign all the points based on this new cluster center.
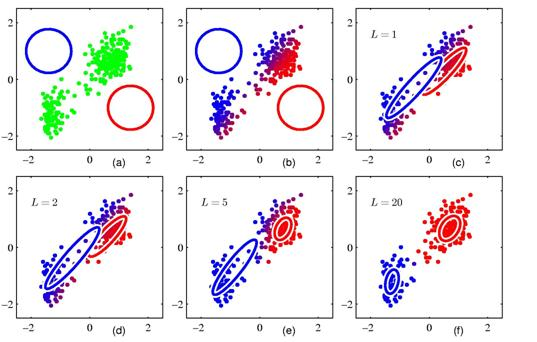
This process will be repeated again and again, till we converge to a point where not much change happens in the clustering process. So in our process, the step where we assign the points to the cluster is called the Expectation step, and the step where we adjust the cluster center is called the Maximization step.
As we have seen that, the lack of pre-requisite is the main problem in unsupervised learning. The biggest challenge in K means clustering is of finding the optimal value of K . It can also be the case that the business expects us to do the clustering for a pre-decided number K, but most of the time it is up to us to decide the optimal value of K.
To do that we have two metrics to calculate,
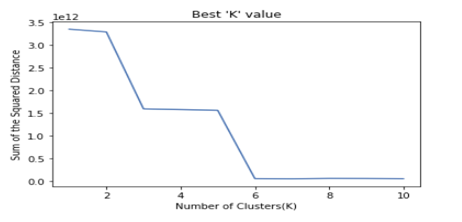
WSS — Within sum of squares = Sum of the distance of each point from the center
Silhouette score- The idea is similar to that of WSS, the formula will be a little different.
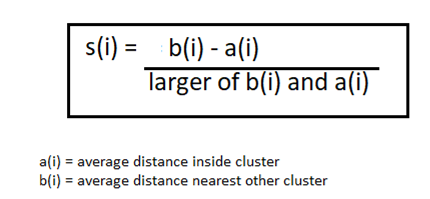
Once we have calculated these values for different values of K, we can plot the value of WSS/Silhouette score we are getting for each, and the point where the value starts to converge can be taken as the right value of K, which then has to be verified by the business anyway.
For example, imagine a Credit Card company trying to divide its customers into segments, so if you find 3 or 4 as the optimal value of K, then they will be fine, but let’s say you found K=11 then that does not make much sense.
Another issue with K-means clustering is that people confuse it with the K nearest neighbors since both of them are classic machine learning techniques, the difference being that K means clustering in an Unsupervised learning Algorithm and K nearest Neighbor is a Supervised learning Algorithm.
Hierarchical:
This is the other most used way of clustering you have two options either you move from top to bottom, giving rise to Divise Hierarchical clustering or you move from bottom to top, giving rise to Agglomerative clustering.
Generally, we notice that Agglomerative Clustering is more used, as you can limit the grouping forming a given number of clusters.
So you start from a single data point and start grouping points that are closer to each other. So let’s say we are in the middle of the process, so you would have the chance to assign a particular point to any closer forming group and that distance between two groups or one group and one point is calculated by the idea of Linkages.
There can be many types of distances that we can have between two points in distribution, like Euclidean , Manhattan Distance, etc, but when we want to calculate the distance between two groups of data points it little tricky.
We may calculate the distance between the two closest points of two groups or two farthest points from both the groups, or we may take the distance from the centroid of one cluster to the centroid of the other, or you may take an average of the distance of all points in one group with all points in another group. All of these forms different kinds of Linkages.
But there is a more intuitive method, so for every group, we can calculate WSS, ie the sum of distances of all points from the center of that cluster.
So, now for G1, we calculate WSS1 and G2 we calculate WSS2 then we take G1 and G2 as a single group and calculate WSS12, now we find the value of
(WSS1+WSS2) — WSS12 = delta.
So now for 3 groups G1, G2, G3 we can use this delta value to find which groups are closer to each other. Closer groups will have a low value of delta.
This is called the Wards method of finding distances between two clusters of data points and is a backbone of what we know as Hierarchical Clustering. It may not tell the exact distance but will tell you which groups are closer.
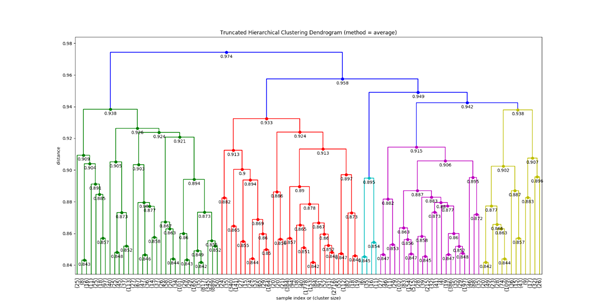
What we get from Hierarchical clustering is a Dendrogram, and based on our understanding of how many clusters we want we can cut the dendrogram by a horizontal line, which gives us a clear view of the kind of clusters formed.
We saw , the two most classic clustering technique, more on similar topics later.
Hope , these clustering techniques are used with cautions and don’t create a division based on some stereotype of the society.


