


In the world of data, Standard Deviation is like a guiding star, illuminating the path to understanding. Picture it as a measure of how data points scatter around the average. It's the statistical compass that helps us navigate through uncertainty.
You might wonder, What is Standard Deviation?, and why does it matter? Well, think of it as a tool that reveals the story behind the numbers. When we say Standard Deviation, we talk about how data points differ from the mean or (average). When the Standard Deviation is larger, the data is more spread out. The smaller it is, the closer the data points cluster around the mean.
In simpler terms, it's like exploring a city. If the Standard Deviation is low, you'll find most places around the city center. But with a high Standard Deviation, you'll explore far and wide, discovering new neighborhoods.
So, whether diving into statistics, math, Data Science, or even Machine Learning, understanding Standard Deviation is your compass. It's the key to unlocking the secrets hidden within data. Let's embark on this journey together as we explore What is Standard Deviation.
Standard Deviation
Understanding Standard Deviation Meaning
Standard Deviation might sound like a mouthful, but let's unravel it step by step. In the world of numbers, it's your trusted gauge for understanding how data behaves.
At its core, Standard Deviation meaning is that it tells us how data points are spread out around the average. Imagine you're tracking the heights of a group of people. If the Standard Deviation is low, it means most people are close to the average size. But if it's high, you'll find folks scattered across a broader range of heights.
Now, why is this critical in math and statistics? and what is Standard Deviation in math? Well, think of it as your data's fingerprint. It helps you see patterns and outliers and make informed decisions. For instance, in finance, Standard Deviation assesses investment risk. In science, it gauges the reliability of experiments.
In simpler words, Standard Deviation gives you a sense of how consistent or varied your data is. It's like knowing whether your pizza slices are all the same size or if they vary wildly.
So, as we dive into What is Standard Deviation, remember that it's your statistical compass, guiding you through the maze of data, helping you make sense of the numbers, and enabling more intelligent decisions in fields as diverse as research, Data Science, and Machine Learning.
The Standard Deviation Formula: Explained
Standard Deviation Formula
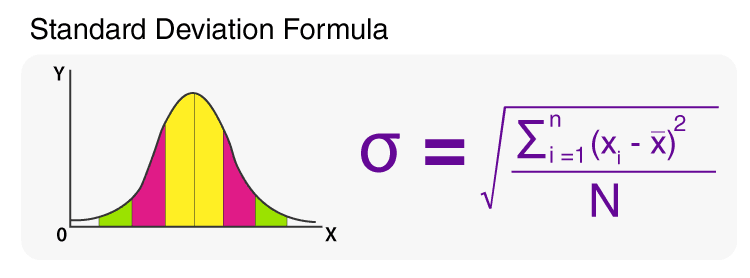
Now, let's dive into the heart of the matter - the Standard Deviation Formula. What is Standard Deviation formula? It's not as daunting as it may seem; it's the tool that brings clarity to data's chaos.
At its core, the formula of Standard Deviation calculates the average distance between each data point and the mean (average) of the dataset. Picture it to quantify how much your data points deviate from the norm.
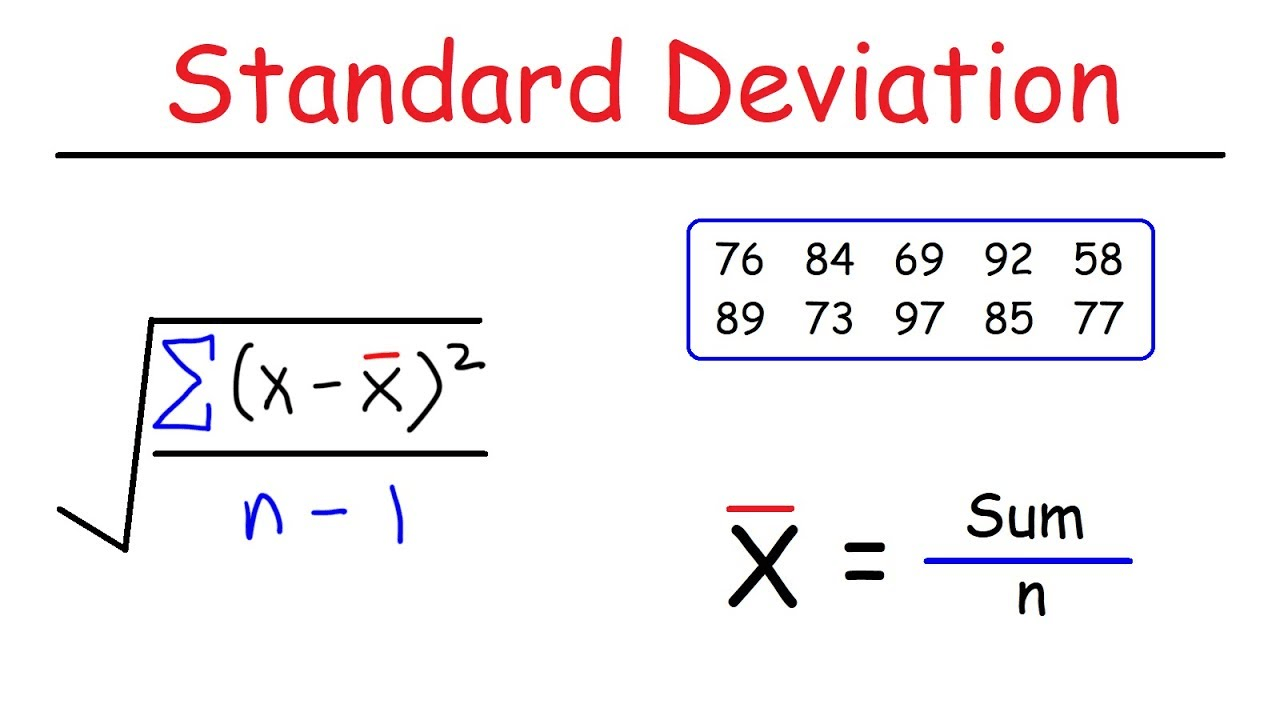
Here's the formula in simple terms:
- Find the mean of your data.
- You need to subtract the mean from each data point to calculate the deviation from the mean.
- Square each deviation (to avoid negatives canceling out positives).
- Find the mean of those squared deviations.
- Finally, take the square root of that mean to get the Standard Deviation.
Why is this formula crucial? It provides a numerical value that tells you how much your data fluctuates. A smaller Standard Deviation means your data points cluster closely around the mean, while a larger one suggests more spread.
Imagine you're a weather forecaster. If you know the Standard Deviation of daily temperatures is low, you can confidently predict that most days will be around the same temperature. But if it's high, you'll expect more significant temperature variations.
So, as we peel back the layers of What is Standard Deviation, remember that this formula is the mathematical magic that unveils data's mysteries, making it invaluable in statistics, research, and the world of Data Science giving clarity to the question “what is Standard Deviation in research”.
Standard Deviation in Statistics
What is Standard Deviation in statistics? Standard Deviation isn't just statistical jargon; it's the compass guiding statisticians through the terrain of data. Standard Deviation is the North Star in the realm of statistics, illuminating the path to deeper insights.
Standard Deviation tells us how scattered or concentrated data points are around the mean (average). Imagine you're analyzing the test scores of a classroom. If the Standard Deviation is small, most students scored close to the class average, indicating consistency. But if it's large, you'll see scores scattered far and wide, revealing variability.
Now, why does it matter in statistics? Think of it as a vital tool for understanding data's behavior. Whether you're studying population growth, stock prices, or disease trends, Standard Deviation helps you gauge data reliability.
For instance, in polling, a low Standard Deviation implies a high level of agreement among respondents, leading to more accurate predictions. Conversely, a high Standard Deviation in finance suggests that asset prices are volatile, influencing investment decisions.
So, in statistics and Data Science, Standard Deviation is your ally. It's the key that unlocks the hidden patterns in data and aids in making informed decisions. As we embark on the journey of "What is Standard Deviation," remember that it's your ticket to understanding the world through the lens of data.
Standard Deviation vs. Variance: A Comparative Insight
What is Standard Deviation and Variance? In the world of data, understanding the dynamic duo of Standard Deviation and Variance is akin to wielding a mighty statistical sword. Let's break down the relationship between these two heavyweights in a straightforward manner:
- Common Goal: Both Standard Deviation and Variance aim to quantify the spread or dispersion of data. They tell us how far data points are from the mean.
- Variance First: Variance, often considered the precursor, measures the average of the squared differences from the mean. It provides a numerical value representing the overall variability.
- Standard Deviation Steals the Show: Standard Deviation, on the other hand, takes the square root of Variance. It does this to bring the measurement back to the original scale of the data. In simpler terms, Standard Deviation is like Variance's friend who's more relatable and user-friendly.
- Units of Measurement: Variance is in squared units, which can be challenging to interpret directly. Standard Deviation, referred to as the square root of Variance, is more intuitive than it is in the original units of measurement.
- Usage: Standard Deviation is often favored in practice because of its ease of interpretation. For instance, when comparing two datasets, it's simpler to say, "Dataset A has a Standard Deviation of 10" rather than "Dataset A has a Variance of 100."
- Analogy: Think of Variance as measuring the spread of pizza slice sizes squared - a numerical value that might not make much sense. Standard Deviation, in this analogy, returns the measurement to the original size of pizza slices, making it easier to grasp.
In summary, while Standard Deviation and Variance play pivotal roles in data analysis, Standard Deviation often takes center stage for its simplicity and ease of communication.
Understanding this duo is critical to mastering the art of data comprehension. As we navigate the "What is Standard Deviation" realm, remember that these two statistical warriors are your allies in unraveling the mysteries hidden within your data.
Standard Deviation Applications
What is standard deviation used for? Standard Deviation isn't just a mathematical concept confined to textbooks; it's a practical powerhouse with real-world applications that span diverse domains. Let's explore its versatile uses:
- Quality Control: In manufacturing, Standard Deviation ensures consistency. For example, in a cookie factory, it guarantees that every cookie's size falls within a specified range.
- Finance: Investors rely on Standard Deviation to assess risk. A low Standard Deviation in an investment portfolio indicates stability, while a high one suggests volatility.
- Healthcare: Standard Deviation helps analyze patient data. It's used in clinical trials to measure the effectiveness of treatments and identify outliers.
- Education: Standard Deviation aids educators in evaluating test scores. A high Standard Deviation may indicate the need for curriculum adjustments.
- Research: Scientists use it to assess data reliability. For instance, climate studies help determine the consistency of temperature measurements.
- Data Science: Standard Deviation plays a crucial role in data analysis. It helps identify patterns, anomalies, and trends, making it invaluable in predictive modeling.
- Machine Learning: What is Standard Deviation in Machine Learning? Algorithms use Standard Deviation to understand data variability. It guides decision-making in various ML applications, from image recognition to fraud detection.
- Risk Assessment: Insurance companies employ Standard Deviation to calculate insurance premiums. A high Standard Deviation may increase insurance premiums due to increased risk.
- Economics: Economists use Standard Deviation to analyze economic data, such as inflation rates or stock market fluctuations, providing insights into market stability.
- Sports Analytics: In sports like basketball, Standard Deviation evaluates player performance consistency, helping teams make informed decisions during player drafts and trades.
In essence, Standard Deviation is a versatile tool that goes beyond numbers. It's a key player in making informed decisions, managing risk, and enhancing the quality of outcomes across various fields.
As we unravel "What is Standard Deviation," remember that its real-world impact is far-reaching, making it an essential concept in the modern data-driven world.
Data Science and Standard Deviation
What is Standard Deviation in Data Science? In Data Science, Standard Deviation is akin to a compass, guiding practitioners through the vast sea of data. It's not just a statistical concept; it's a fundamental pillar of this field, playing a crucial role in decision-making.
Defining Data Precision: Standard Deviation helps Data Scientists understand how data points behave within a dataset. Imagine you're analyzing sales data for a retail chain. A low Standard Deviation suggests that sales figures hover closely around the average, indicating a predictable pattern. However, a high Standard Deviation implies that sales are more erratic, requiring a different approach.
Risk Assessment: Data Scientists use Standard Deviation in finance to evaluate investment portfolios. A portfolio with a high Standard Deviation may yield higher returns but carries more significant risk. This insight helps investors make informed decisions aligned with their risk tolerance.
Quality Control: Standard Deviation ensures data quality. When analyzing customer feedback in a call center, a high Standard Deviation might signal inconsistent service quality, prompting management to investigate and improve processes.
Machine Learning: Algorithms rely on Standard Deviation to understand data variability. In image recognition, for instance, it helps distinguish between a clear image and a blurry one, ultimately improving accuracy.
Business Intelligence: Standard Deviation aids in market analysis. Data Scientists use it to gauge the volatility of stock prices, providing valuable insights to traders and investors.
In essence, Standard Deviation is the tool Data Scientists use to separate signal from noise. It helps understand data patterns, make predictions, and draw actionable insights. As we unravel "What is Standard Deviation in simple words," remember that in the world of Data Science, the North Star guides us through the data wilderness, enabling us to make data-driven decisions that shape our world.
Conclusion
In our voyage through Standard Deviation, you've gained a valuable compass for your educational and professional journey. Whether you're seeking clarity on "what is Standard Deviation definition," or a Data Science course, pursuing a masters in computer science, or exploring the innovative pay after placement, Standard Deviation is your secret weapon.
This simple yet powerful concept isn't just about numbers; it's about making sense of the world's data. It empowers you to decipher patterns, make informed decisions, and thrive in data-driven fields. And don't forget the value of an exemplary Data Science tutorial – it's your guide to mastering this essential skill.
So, as you set sail towards your dreams, remember that Standard Deviation is your key to success. It's the tool that opens doors in the ever-evolving world of Data Science. Embrace it, master it, and watch your journey toward excellence unfold.


