


Classification
Let us first look into the evaluation metrics used in classification models. Here we will not only get to know the metrics we will also see which ones are used in a specific business problem.
For a classification-based model, all the parameters are included inside a metric called Confusion Matrix.
AConfusion matrix is an M x M matrix used for assessing the performance of a classification model, where M is the number of predicted classes. The matrix compares the actual predicted values with those predicted by our classification model. This gives us a comprehensive view of how well our classification model is performing and what kind of metric is reliable.
Since we will be looking at binary classification, let us take a 2 x 2 matrix as shown below with 4 values:
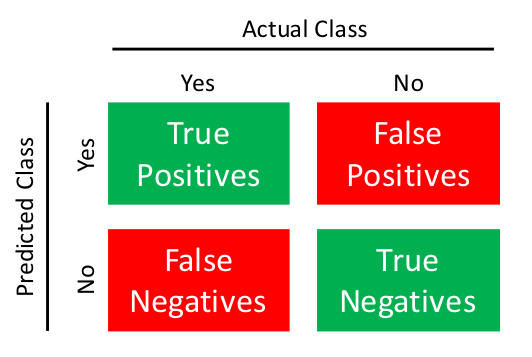
Here ‘Actual Class’ is what actually happened and ‘Predicted Class’ is what my model predicted. Now let me explain the diagram with a realistic example. Let us imagine a classification model that predicts whether it will rain or not rain. ‘Rain’ is a positive class and ‘Not rain’ is a negative class. True positive (TP) is when my model predicts Rain and it actually rains. True Negative (TN) is when my model predicts Not Rain and it doesn’t rain in real. Whereas False Positive (FP) is when my model predicts a positive class(Rain) but it turns out to be false and it doesn’t rain. Similarly, False Negative (FN) is when my model predicts a negative class ( Not Rain) but it rains on that day.
Based on these four parameters we will define evaluation metrics like Accuracy, Recall, Precision, and F1_Score.

ACCURACY
In very simple terms accuracy is an evaluation metric that measures the total number of predictions that my model got right out of the total number of predictions it made. In terms of confusion matrix, the formula for accuracy is;
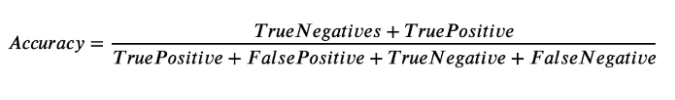
Accuracy takes into account both True positives and True negatives, many a time we might need any one of them, for which there are other metrics defined. Every term in the formula of Accuracy is present in the confusion matrix and we can calculate it accordingly. Many a time the model built is fairly accurate but it still can’t solve a business problem. Such cases arise when we have an imbalanced dataset i.e. a dataset that has a majority of observations in the positive class and very few observations in the negative class and vice versa.
For example, you build a model to predict if the email you got is spam or not. In this case, 1 maybe 2 emails out of 100 that you get, turn out to be spam. So if you build a model which shows all mails are legitimate you will still achieve an accuracy of 98% but it will neglect all the spam emails and the model does not work in any way. When accuracy is not a good metric to evaluate your model you need to look at other metrics.
PRECISION
In very simple terms precision measures how precisely a model predicts the positive labels. In other words, out of all the positive predictions how many were correctly predicted. The formula for precision is given below:

The numerator of this formulae essentially tells us the positive observations that my model predicts correctly. The denominator essentially shows all the points that my models predicted as positive.
RECALL
Also known as true positive rate(TPR) or Sensitivity, recall can be defined as out of all the actual positive values, how many of them were predicted correctly. The formula for the recall is given below :
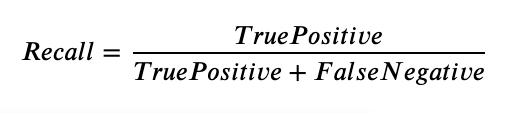
The numerator is the same as precision. but the denominator has all the actual positive values irrespective of which class the model predicted it to.
Now let me give explain to you both precision and recall in realistic terms to get a better intuition. Imagine your friend gives you a present at every birthday for the past 10 years. In the 11th year she makes a bet, she says that I will give you your favorite PlayStation if you can correctly guess all the 10 presents that I gave you over the course of 10 years. Now you really want PlayStation so you try hard to recall each present one by one. Suppose you were able to recall 7 presents out of 10, therefore you have a recall of 7/10 i.e. 70 %. Now to further the bet she says okay you try to guess the other presents you can take infinite guesses. you try your best and were able to name all 10 presents in 20 tries. Though this makes your recall as 100% you were not precise enough, your Precision gets as low as 10/20 i.e. 50%. Hope this gives more clarity on both the terms.
How do you choose between precision and recall for your business problem?
The best explanation for this is to choose Precision when your False-positives cost you more than your False-negatives. For example imagine you sell gym products, your invest in a brand of protein supplements as suggested by your ML model. But it turns out that you got a false positive signal and your customers hate the supplement and you incur a huge loss. Any business problem which involves investing in your output prediction such as giving loans, customer churn analysis, other banking systems you use Precision.
Now imagine you have to deploy a model in the health sector, detecting cancer in patients. Here if you get any false negatives i.e. you get a prediction that the patient doesn’t have cancer whereas, in reality, he has cancer, in this case, his life is at risk because of wrong predictions. So any business problem where a False-negative can cost you more than a False-positive you use Recall. Other places that you can use recall are credit card fraud prediction, all healthcare domains, etc.
What happens if your data has class imbalance but you cant choose between precision and recall as both hold equal importance. In such cases, you go for an amalgamation of both, there is a metric that combines both precision and recall and is named f1_score.
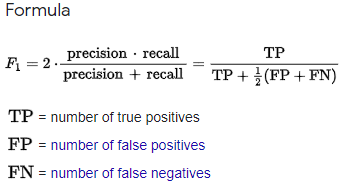
F1_score also known as F Measure is the harmonic mean of both precision and recall. F1 score can be calculated using the following formula.
REGRESSION
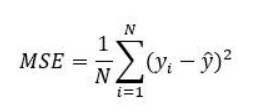
Evaluation metrics play a very significant role in building any machine learning model. The Mean squared error, root mean squared error, mean absolute error, R-Squared, and Adjusted R-squared are used to evaluate the performance of the model in regression algorithms.
Mean Squared Error(MSE) measures the arithmetic mean of the squared difference between the actual and predicted values in the dataset. It is a measure of the variance of residuals.
Mean absolute error(MAE) measures the arithmetic mean of the absolute difference between the actual and the predicted values in the dataset. It measures the average of residuals.

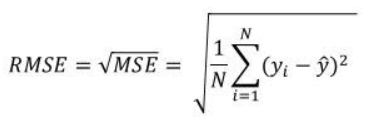
Root Mean Squared Error(RMSE) is nothing but the square root of the mean squared error that we calculated earlier. It measures the root of variance i.e. standard deviation of residuals.
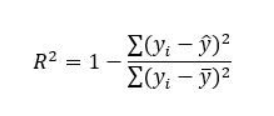
R-squared measures the degree to which variance in the dependent variable can be explained by the independent variables(features). It will always range from 0 to 1, the higher the R-squared better is my model. It is a relative metric that can be used to compare when we apply more than one algorithm.
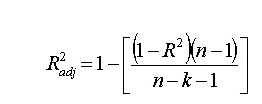
Adjusted R squared is a slight modification to the R-square value, this measures the variance in the target variable, explained by only the features that are helpful in making predictions, it will always be less than or equal to R² because it will penalize you for adding features which are not useful in making predictions. In the formula below n is the number of rows in the data and k is the number of columns in the data.
What to choose between MSE, RMSE, MAE, and MAPE?
Whenever you have to penalize the outliers present in the dataset you use either MSE or RMSE. I personally prefer RMSE over MSE as the latter does not have the same unit as my predicted value.
Use MAE when your predictions do not get affected by outliers as MAE is robust to outliers.
RMSE and MSE both are differentiable and are generally chosen over MAE, as MAE is not differentiable when actual value = predicted value.
Whenever your mean predicted values are large(in thousands or millions), choose MAPE(mean absolute percentage error) over the others as very large error values might look misleading.
R-Squared is a relative metric and should be preferred to compare models when we apply more than one algorithm.
Both R-Squared and the Error metrics hold important information, as the former tells us the relationship between independent and dependent variables and the latter tells us about how close are actual and predicted values.
CONCLUSION
We often make the mistake of randomly applying these evaluation metrics to access our model’s performance, but data science is all about asking the question “why?”.That is exactly what we should be doing while choosing certain evaluation metrics over others. With this blog, I hope I am able to clear the intuitions between different evaluation metrics used in classification as well as regression analysis.
Happy Learning!


