Your Success, Our Mission!
6000+ Careers Transformed.
Probability distributions are mathematical functions that describe the likelihood of different outcomes in a random event or experiment. Two common probability distributions are the Binomial Distribution and Poisson Distribution. These distributions are frequently used in statistics to model the behavior of discrete data.
This article will explore the definitions, formulas, applications, mean and variance, probability density functions, relationship between the two distributions, limitations, and assumptions of Binomial and Poisson distributions.
The Binomial Distribution is a probability distribution that describes the number of successes in a fixed number of independent trials with two possible outcomes, usually labeled as success (S) or failure (F). The trials must be independent and have the same probability of success. The probability of success is denoted as p, and the probability of failure is denoted as q = 1 - p.
The formula for the Binomial Distribution is:
P(X = k) = (n choose k) * p^k * q^(n-k)
where:
For example, suppose a company is launching a new product and conducts a survey of 100 potential customers. The probability of a customer buying the product is 0.2. The company wants to know the probability that exactly 25 customers will buy the product. Using the Binomial Distribution formula, we have:
P(X = 25) = (100 choose 25) * 0.2^25 * 0.8^75
                    = 0.086
Therefore, the probability of exactly 25 customers buying the product is 0.086 or 8.6%.
The Poisson Distribution is a probability distribution that describes the number of events that occur in a fixed interval of time or space, assuming that the events occur independently and at a constant rate. The rate of occurrence is denoted as λ.
The formula for the Poisson Distribution is:
P(X = k) = (e^-λ * λ^k) / k!
where:
For example, suppose a store receives an average of 10 customers per hour. The store wants to know the probability of having exactly 12 customers in the next hour. Using the Poisson Distribution formula, we have:
P(X = 12) = (e^-10 * 10^12) / 12!
                  = 0.094
Therefore, the probability of having exactly 12 customers in the next hour is 0.094 or 9.4%.
Binomial Distribution and Poisson Distribution have different applications in real-world scenarios. Here are a few cases:
The mean and variance of a probability distribution are measures of its central tendency and variability, respectively. The mean of the Binomial Distribution is given by:
μ = np
where:
The variance of the Binomial Distribution is given by:
σ^2 = npq
where:
The mean and variance of the Poisson Distribution are both equal to the rate parameter λ, i.e.,
μ = σ^2 = λ
For example, using the same scenario as before, the mean and variance of the Binomial Distribution for the company launching a new product are:
μ = 100 * 0.2 = 20
σ^2 = 100 * 0.2 * 0.8 = 16
Therefore, the expected number of customers buying the product is 20, and the variance is 16.
Using the same scenario for the store receiving an average of 10 customers per hour, the mean and variance of the Poisson Distribution are:
μ = σ^2 = λ = 10
Therefore, the expected number of customers in the next hour is 10, and the variance is also 10.
The probability density function (PDF) of a probability distribution is a function that describes the probability of a random variable taking on a certain value. The PDF of the Binomial Distribution is given by:
f(k) = (n choose k) * p^k * q^(n-k)
where:
The PDF of the Poisson Distribution is given by:
f(k) = (e^-λ * λ^k) / k!
where:
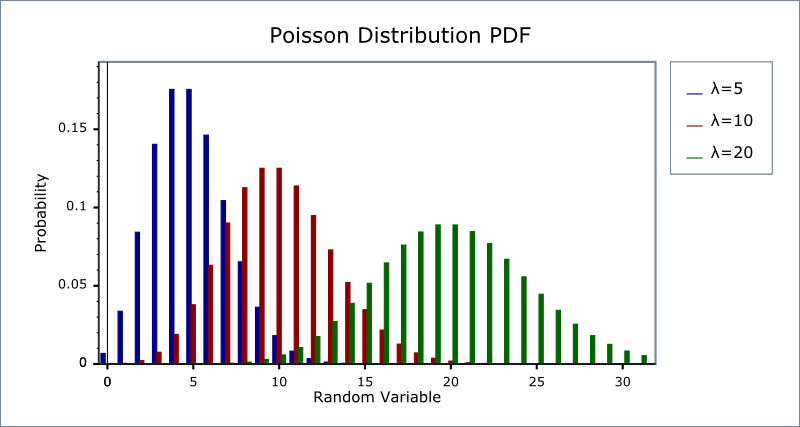
Poisson Distribution PDF
The Binomial Distribution can be approximated by the Poisson Distribution when the number of trials is large and the probability of success is small. Specifically, if np < 10, the Binomial Distribution can be approximated by the Poisson Distribution with a rate parameter of λ = np. In this case, the formula for the Poisson Distribution can be used to calculate the probabilities.
For example, suppose a company sells 10,000 products and the probability of a defective product is 0.001. Using the Binomial Distribution formula, the probability of having exactly 5 defective products is:
P(X = 5) = (10,000 choose 5) * 0.001^5 * 0.999^9,995
= 0.036
However, since np = 10, which is less than 10, the Binomial Distribution cannot be approximated by the Poisson Distribution. Therefore, we need to use the Binomial Distribution formula to calculate the probability.
Both the Binomial and Poisson Distributions have certain limitations and assumptions that need to be considered when using them to model real-world phenomena. Some of the main limitations and assumptions are:
Violation of these assumptions can lead to inaccurate modelling and predictions. For example, if the probability of success in the Binomial Distribution varies for different trials or if the events in the Poisson Distribution are not independent, the resulting distribution may not accurately reflect the real-world phenomenon being modelled.
The Binomial and Poisson Distributions are powerful tools for modeling and predicting the probabilities of discrete events. While they have different applications and characteristics, they are both important tools in probability theory and statistics. Understanding their formulas, properties, and assumptions can help researchers, analysts, and decision-makers make informed decisions and predictions in a wide range of fields, from business and finance to healthcare and engineering.
1. What type of distribution models the probability of a certain number of events occurring in a fixed interval of time or space, assuming a constant rate of occurrence?
A. Binomial Distribution
B. Poisson Distribution
C. Normal Distribution
D. Exponential Distribution
Answer: B. Poisson Distribution
2. What is the mean of the Binomial Distribution?
A. np
B. p
C. q
D. n
Answer: A. np
3. Which distribution can be approximated by the Poisson Distribution when the number of trials is large and the probability of success is small?
A. Poisson Distribution
B. Binomial Distribution
C. Normal Distribution
D. Exponential Distribution
Answer: B. Binomial Distribution
4. What is one of the assumptions of the Poisson Distribution?
A. The trials must be independent and identically distributed.
B. The number of trials must be fixed.
C. Each trial must have only two possible outcomes.
D. The rate of occurrence of events must be constant over time.
Answer: D. The rate of occurrence of events must be constant over time.
Top Tutorials

Python
Python is a popular and versatile programming language used for a wide variety of tasks, including web development, data analysis, artificial intelligence, and more.

SQL
The SQL for Beginners Tutorial is a concise and easy-to-follow guide designed for individuals new to Structured Query Language (SQL). It covers the fundamentals of SQL, a powerful programming language used for managing relational databases. The tutorial introduces key concepts such as creating, retrieving, updating, and deleting data in a database using SQL queries.

Data Science
Learn Data Science for free with our data science tutorial. Explore essential skills, tools, and techniques to master Data Science and kickstart your career
All Courses (6)
Master's Degree (2)
Fellowship (2)
Certifications (2)


