Your Success, Our Mission!
6000+ Careers Transformed.
Probability distributions are a critical tool in statistics and data analysis. The Chi-Square Distribution and Student's t-Distribution are two widely used probability distributions that are used to model real-world phenomena. In this article, we will explore these two distributions, their properties, and their applications in detail.
The Chi-Square Distribution is a continuous probability distribution that is used to model the sum of the squares of independent standard normal random variables. It is a special case of the Gamma Distribution with shape parameter k/2 and scale parameter 2. The Chi-Square Distribution is denoted by χ²(df), where df denotes the degrees of freedom.
The Chi-Square Distribution has several important properties, such as:
The Chi-Square Distribution has many applications in statistics, such as:
The degrees of freedom in the Chi-Square Distribution are related to the number of standard normal random variables being squared and summed. In general, the degrees of freedom increase as the sample size increases.
The Chi-Square Distribution is commonly used in hypothesis testing. For example, the Chi-Square Test of Independence can be used to test whether two categorical variables are independent of each other.
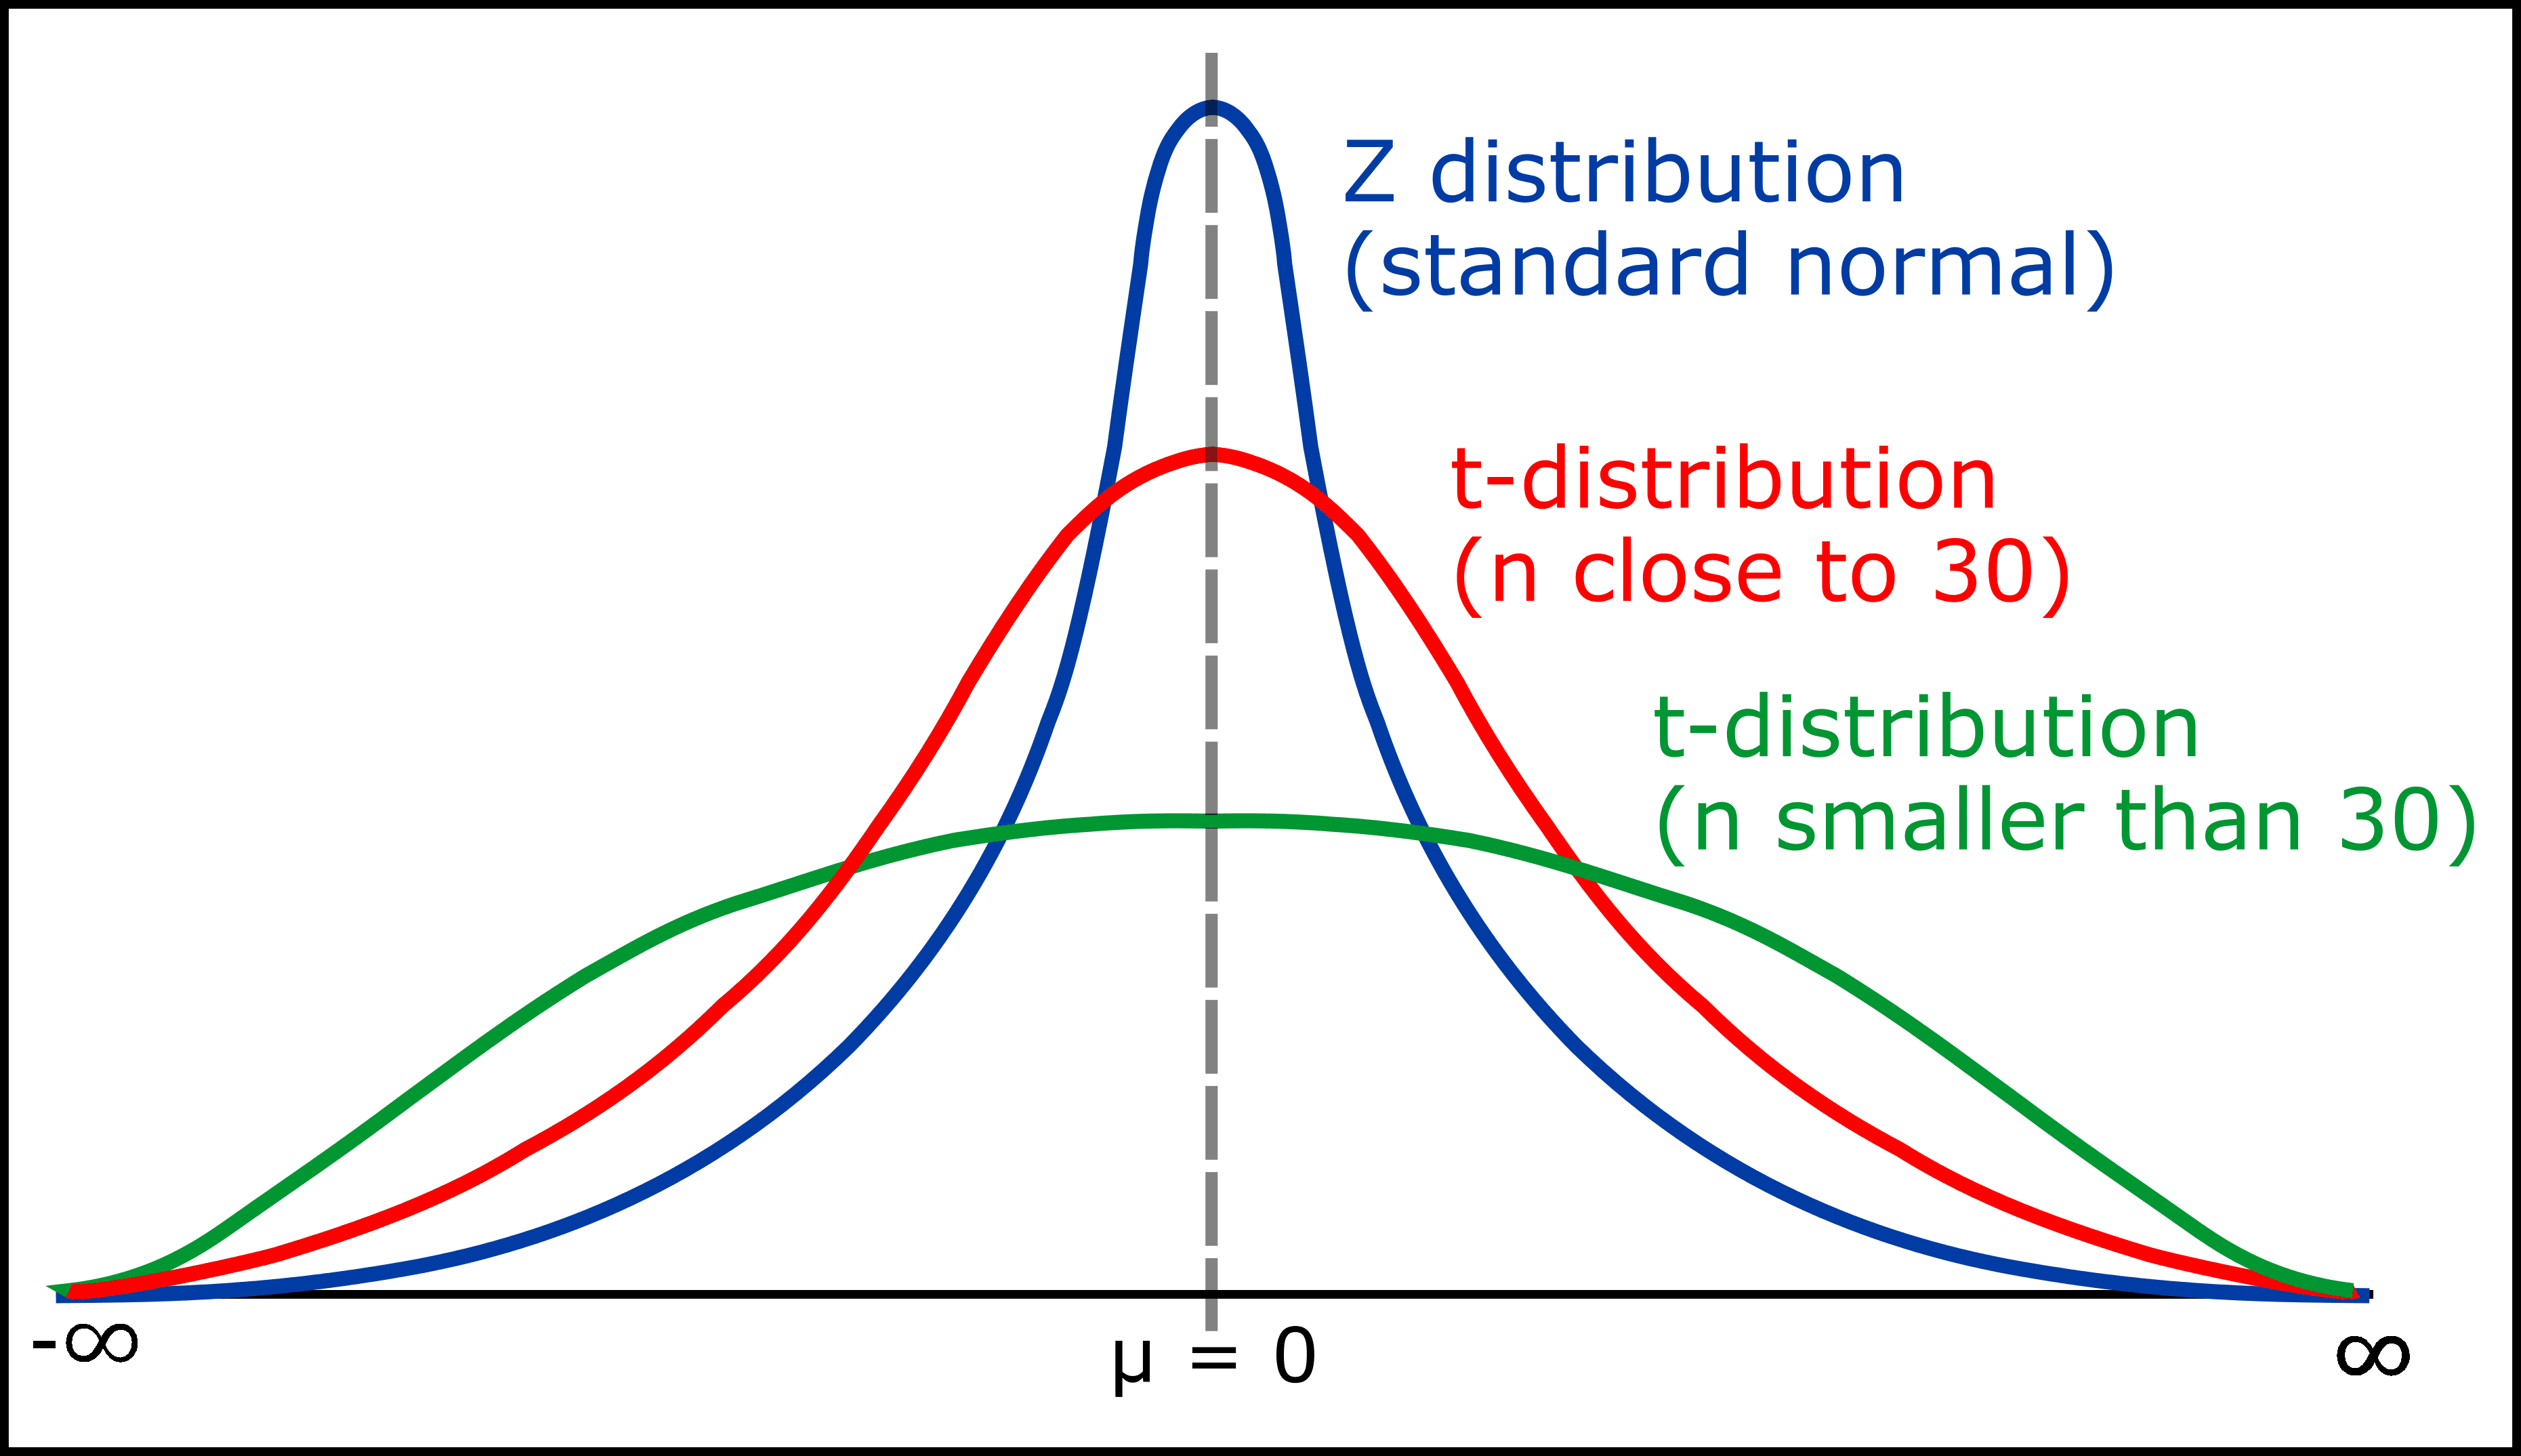
The Student's t-Distribution is a continuous probability distribution that is used to model the distribution of the t-statistic. It is commonly used in hypothesis testing when the sample size is small and the population variance is unknown. The Student's t-Distribution is denoted by t(df), where df denotes the degrees of freedom.
Student's t-Distribution
The Student's t-Distribution has several important properties, such as:
The Student's t-Distribution has many applications in statistics, such as:
In conclusion, Chi-Square Distribution and Student's t-Distribution are important probability distributions commonly used in statistics. The Chi-Square Distribution is used for testing goodness of fit, independence in contingency tables, homogeneity in contingency tables, and variance in a population. The Student's t-Distribution is used for testing the mean of a population when the population variance is unknown and for confidence interval estimation for the mean of a population when the population variance is unknown.
1. What is the Chi-Square Distribution used for?
A) Testing the mean of a population
B) Testing independence in contingency tables
C) Estimating population parameters
D) Modeling continuous random variables
Answer: B
2. What is the Student's t-Distribution used for?
A) Testing the variance of a population
B) Testing the mean of a population when the population variance is known
C) Testing the mean of a population when the population variance is unknown
D) Modeling discrete random variables
Answer: C
3. What is the mean of the Chi-Square Distribution?
A) It depends on the degrees of freedom
B) It is always equal to 0
C) It is always equal to 1
D) It is always equal to the degrees of freedom
Answer: D
4. How are the degrees of freedom related to the Student's t-Distribution?
A) As sample size increases, degrees of freedom decrease
B) As sample size increases, degrees of freedom increase
C) Degrees of freedom are not related to the Student's t-Distribution
D) Degrees of freedom increase as the population variance becomes more known
Answer: B
Top Tutorials

Python
Python is a popular and versatile programming language used for a wide variety of tasks, including web development, data analysis, artificial intelligence, and more.

SQL
The SQL for Beginners Tutorial is a concise and easy-to-follow guide designed for individuals new to Structured Query Language (SQL). It covers the fundamentals of SQL, a powerful programming language used for managing relational databases. The tutorial introduces key concepts such as creating, retrieving, updating, and deleting data in a database using SQL queries.

Data Science
Learn Data Science for free with our data science tutorial. Explore essential skills, tools, and techniques to master Data Science and kickstart your career
All Courses (6)
Master's Degree (2)
Fellowship (2)
Certifications (2)


