Your Success, Our Mission!
6000+ Careers Transformed.
The article on Confidence Intervals and Margin of Error discusses the methods used in statistics to determine the reliability of sample data. It highlights the factors that affect confidence intervals and margin of error and provides practical examples in political polling, medical research, and marketing surveys. It compares confidence intervals with hypothesis testing and addresses common mistakes and misconceptions.
Confidence intervals and margin of blunder are imperative concepts in insights that permit us to gauge populace parameters based on test information. In this article, we'll investigate these concepts in detail and give illustrations to demonstrate their viable applications.
Confidence intervals are a range of values within which we can be confident that the true population parameter lies. This range is estimated based on a sample from the population and a chosen level of confidence. The level of confidence speaks to the likelihood that the genuine populace parameter lies inside the certainty interim.
Confidence intervals are calculated utilizing the test cruel and standard deviation, along side a t-distribution or a z-distribution, depending on the test estimate and population variance. The equation for a certainty interim is:
Confidence Interval = sample mean ± (critical value)(standard error)
The critical value is based on the level of certainty and the degrees of freedom (df), which is calculated as n-1 for a test of measure n. The standard blunder is calculated as the standard deviation separated by the square root of the test measure.
For illustration, assume we need to gauge the normal tallness of all college understudies within the United States with 95% certainty. We take a random test of 50 college understudies and degree their statures. The sample mean is 68 inches and the standard deviation is 3 inches. Using a t-distribution with 49 degrees of freedom and a 95% confidence level, the critical value is 2.009. The standard error is 3 / sqrt(50) = 0.424. Therefore, the 95% confidence interval for the population mean height is:
68 ± (2.009)(0.424) = (67.15, 68.85)
This means that we can be 95% confident that the true population mean height falls between 67.15 inches and 68.85 inches.
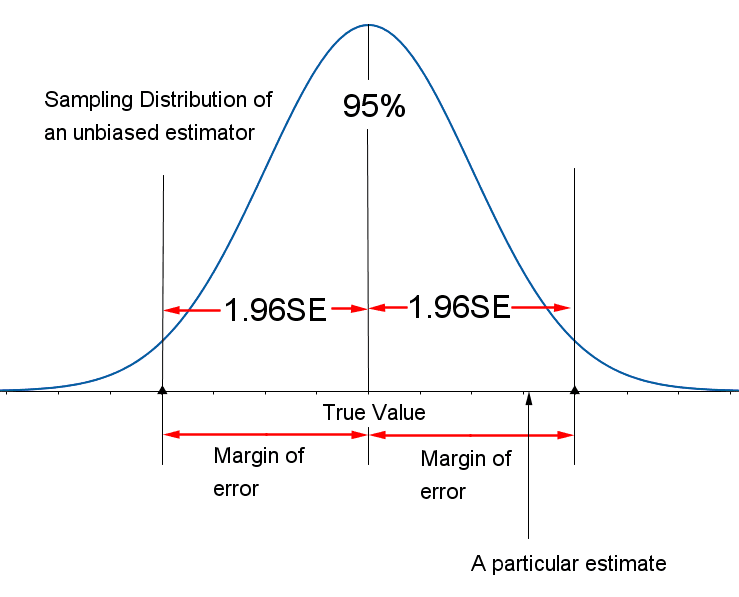
Margin of error is the degree of accuracy or precision of our estimate. It represents the maximum amount that our estimate can differ from the true population parameter, given a certain level of confidence. Margin of error is calculated as:
Margin of Error = (critical value)(standard error)
The critical value is based on the level of confidence and the degrees of freedom, and the standard error is calculated as before. Margin of error is often expressed as a percentage of the sample mean, known as the relative margin of error.
The margin of error is calculated using the formula:
Margin of Error = Critical value x Standard Error
The critical value is determined based on the desired level of confidence and the degrees of freedom. For example, for a 95% confidence level with a sample size of 100, the critical value would be 1.96.
The standard error is calculated using the formula:
Standard Error = Standard Deviation / √(Sample Size)
For example, if we have a sample size of 100 and a standard deviation of 5, the standard error would be 5/√100 = 0.5.
So, if we wanted to calculate the margin of error for a 95% confidence level with a sample size of 100 and a standard deviation of 5, we would have:
Margin of Error = 1.96 x 0.5 = 0.98
This means that we can be 95% confident that the true population mean falls within a range of plus or minus 0.98 units from the sample mean.
When interpreting a confidence interval, it is imperative to be beyond any doubt the level of confidence and the margin of mistake. For illustration, on the off chance that we have a 95% confidence interval with a margin of mistake of 0.5, we are able say that we are 95% certain that the genuine populace cruel falls inside a run of furthermore or short 0.5 units from the test cruel.
On the off chance that the confidence interval does not contain the hypothesized esteem, at that point we will dismiss the null hypothesis and conclude that the population mean is distinctive from the hypothesized esteem. In any case, in case the confidence interim does contain the hypothesized esteem, at that point we cannot dismiss the null hypothesis and conclude that there's not sufficient evidence to propose that the population mean is distinctive from the hypothesized esteem.
Confidence intervals and margin of blunder are impacted by a few components that influence their exactness and accuracy. These variables incorporate test size, level of certainty, and inconstancy of the information.
Confidence intervals and margin of blunder are commonly utilized in different areas to assess populace parameters and make deductions around the populace. Here are a few viable illustrations:
1. Political surveying: In political surveying, certainty interims and edge of mistake are utilized to assess the extent of voters who back a candidate or a arrangement. The edge of blunder shows the accuracy of the assess, and the certainty interim gives a run of values where the genuine extent is likely to be.
2. Restorative investigate: In therapeutic inquire about, certainty interims and edge of blunder are utilized to appraise the contrast in implies between two bunches or the impact of a treatment. The edge of blunder demonstrates the accuracy of the assess, and the certainty interim gives a run of values where the genuine distinction or impact measure is likely to be.
3. Marketing surveys: In showcasing overviews, certainty interims and edge of mistake are utilized to gauge the extent of clients who are fulfilled with a item or benefit. The margin of the error shows the accuracy of the appraise, and the certainty interim gives a extend of values where the genuine extent is likely to be.
Confidence intervals and hypothesis testing are two approaches used to make inferences about population parameters based on sample data. While both approaches are related, they have some differences in their interpretation and application.
Differences and similarities: Confidence intervals provide a range of values where the true population parameter is likely to be, while hypothesis testing tests a specific hypothesis about the population parameter. Both approaches use sample statistics to estimate the population parameter and involve assumptions about the data distribution.
Pros and cons of each approach: Confidence intervals are useful for estimating the population parameter with a certain degree of precision, and for comparing two or more groups or treatments. Hypothesis testing is useful for testing a specific hypothesis about the population parameter and for making decisions based on the evidence.
Confidence intervals and margin of error are sometimes misinterpreted or misunderstood, leading to common mistakes and misconceptions.
Misinterpreting confidence intervals: A confidence interval does not provide a probability that the true population parameter is within the interval. It only indicates the level of confidence that the interval captures the true population parameter.
Misunderstanding margin of error: The margin of error is not a fixed value and depends on several factors, such as sample size and level of confidence. It also only captures the random sampling error and not the systematic errors or biases.
Incorrectly comparing confidence intervals: Comparing two confidence intervals does not necessarily indicate whether the difference between the two population parameters is statistically significant. Hypothesis testing is a more appropriate approach for testing such differences.
Confidence intervals make several assumptions about the data, including the assumption that the data is normally distributed and that the sample is representative of the population. Additionally, confidence intervals only provide information about the parameter being estimated and do not provide information about other parameters or relationships in the data.
Confidence intervals and margin of error are important tools for estimating population parameters and assessing the precision of sample estimates. By understanding these concepts, we can make more informed decisions based on data and draw more accurate conclusions from statistical analyses.
1. What is the effect of increasing the sample size on the margin of error in a confidence interval?
a) Margin of error decreases
b) Margin of error increases
c) Margin of error remains the same
d) It depends on the level of confidence
Answer: a) Margin of error decreases
2. What is the level of confidence typically used in confidence intervals?
a) 50%
b) 75%
c) 90%
d) 100%
Answer: c) 90%
3. What is the purpose of hypothesis testing?
a) To estimate the population parameter
b) To find the sample mean
c) To test if a given hypothesis is true or not based on sample data
d) To calculate the margin of error
Answer: c) To test if a given hypothesis is true or not based on sample data
4. Which of the following is a common mistake in interpreting confidence intervals?
a) Comparing confidence intervals with hypothesis testing
b) Misunderstanding the margin of error
c) Using a level of confidence less than 50%
d) Using a sample size that is too small
Answer: b) Misunderstanding the margin of error
Top Tutorials

Python
Python is a popular and versatile programming language used for a wide variety of tasks, including web development, data analysis, artificial intelligence, and more.

SQL
The SQL for Beginners Tutorial is a concise and easy-to-follow guide designed for individuals new to Structured Query Language (SQL). It covers the fundamentals of SQL, a powerful programming language used for managing relational databases. The tutorial introduces key concepts such as creating, retrieving, updating, and deleting data in a database using SQL queries.

Data Science
Learn Data Science for free with our data science tutorial. Explore essential skills, tools, and techniques to master Data Science and kickstart your career
All Courses (6)
Master's Degree (2)
Fellowship (2)
Certifications (2)


