Your Success, Our Mission!
6000+ Careers Transformed.
Overview
Classification metrics are a set of metrics used to evaluate the performance of classification models. These metrics are used to assess model accuracy, precision, recall, and other aspects. It is often used to compare different models or tune a single model for optimal performance. Classification metrics can be grouped into three main categories: Accuracy, sensitivity, specificity. Accuracy measures the overall performance of the model and is usually the most important metric. Sensitivity and specificity measure how well a model can distinguish different classes. Finally, other metrics such as AUC score, F1 score, and Kappa score measure model accuracy and recognition.
General indicators:
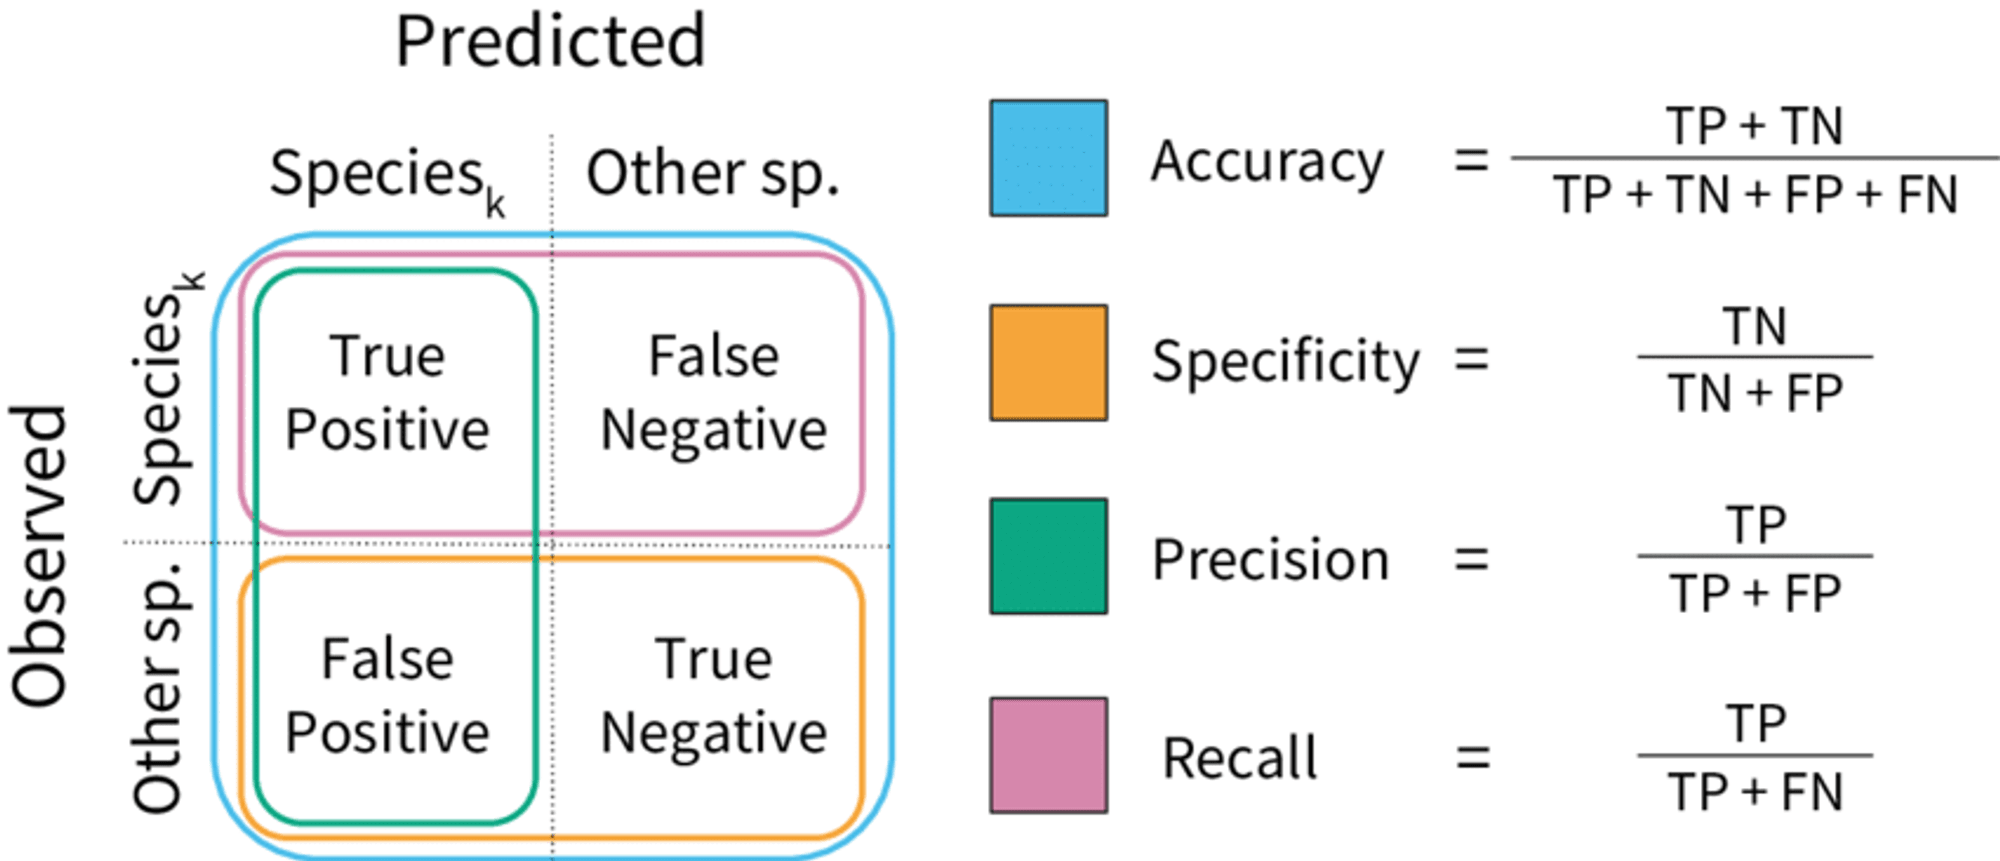
1.Accuracy: Accuracy of a classification model is the percentage of correctly classified instances out of all instances in the dataset. It can be expressed as a fraction or percentage and is calculated using the following formula:
Accuracy = (number of positives + number of positives/negatives) / total number of instances
2. Precision: Precision measures the proportion of true positives (correctly classified positive cases) out of all cases classified as positive. Calculated using the following formula:
precision= number of true positives / (number of true positives + number of false positives)
3. Recall: Recall measures the proportion of true positives among all actual positive instances. Calculated using the following formula:
recall = number of true positives / (number of true positives + number of false negatives)
4. F1 score: The F1 score combines precision and recall to produce a single score that is the harmonic average of the two metrics. Calculated using the following formula:
F1 score = 2 * (accuracy * memory) / (accuracy + memory)
5. Receiver Operating Characteristic (ROC) Curve: A ROC curve is a graphical representation of the trade-off between the true positive rate (recall rate) and the false positive rate (the percentage of negative instances falsely classified as positive) for different classification thresholds. Area under the ROC curve (AUC) is a metric that summarizes the ROC curve and produces a single value representing the overall performance of the model.
6. Area under the ROC curve (AUC): Area under the ROC curve (AUC) is a metric that summarizes the ROC curve and produces a single value representing the overall performance of the model. Calculated using the following formula:
AUC = (true positive rate + false positive rate) / 2
7.Confusion matrix: A confusion matrix is a table that summarizes the classification results and indicates the number of true positive, true negative, false positive, and false negative results.
8.Class Imbalance: Class imbalance is a problem that occurs when one class (positive or negative) has significantly more instances than the other class. This can lead to a biased classification model targeting the majority class. Strategies to address class imbalance include data preprocessing techniques such as oversampling, undersampling, and SMOTE, as well as model-based approaches such as cost-sensitive learning and class-weighting algorithms.
9.Precision recall curve: Accuracy recall curve is another graphical representation of classification results and it is more informative than ROC curve in situations where data is not balanced. It shows precision and recall for different classification thresholds.
10.Cross Validation:
Cross-validation could be a strategy utilized to assess the execution of classification models and compare distinctive models. This includes part the dataset into k subsets, training a model on k-1 subsets, and testing on the remaining subsets.
Classification metrics are a set of measures utilized to assess the execution of a classification demonstrate. These measurements are utilized to evaluate the precision, accuracy, recall, and other perspectives of the model. They are frequently utilized to compare diverse models or to tune a single demonstrate for ideal execution. Classification measurements can be partitioned into three fundamental categories: accuracy, sensitivity and specificity. Accuracy measures the generally execution of the show and is as a rule the foremost imperative metric. Sensitivity and specificity measure how well the model can distinguish between different classes. Finally, other metrics such as the AUC score, F1 score, and Kappa score measure the precision and recall of the model.
Common metrics:
The accuracy of a classification model is the proportion of correctly classified instances among all instances in the dataset.
It can be expressed as a fraction or percentage, and is calculated using the following equation:
Accuracy = (Number of True Positives + Number of True Negatives) / Total Number of Instances
2. Precision: Precision measures the proportion of true positives (correctly classified positive instances) among all instances classified as positive. It is calculated using the following equation:
Precision = Number of True Positives / (Number of True Positives + Number of False Positives)
3. Recall: Recall measures the proportion of true positives among all actual positive instances. It is calculated using the following equation:
Recall = Number of True Positives / (Number of True Positives + Number of False Negatives)
4. F1 Score: The F1 score combines precision and recall to give a single score that represents the harmonic mean of the two metrics. It is calculated using the following equation:
F1 Score = 2 * (Precision * Recall) / (Precision + Recall)
5. Receiver Operating Characteristic (ROC) Curve: A ROC curve is a graphical representation of the trade-off between true positive rate (recall) and false positive rate (the proportion of negative instances that are incorrectly classified as positive) for different classification thresholds. The area under the ROC curve (AUC) is a metric that summarizes the ROC curve, giving a single value that represents the overall performance of the model.
6. Area Under the ROC Curve (AUC): The area under the ROC curve (AUC) is a metric that summarizes the ROC curve, giving a single value that represents the overall performance of the model. It is calculated using the following equation: AUC = (True Positive Rate + False Positive Rate) / 2
7. Confusion Matrix: A confusion matrix is a table that summarizes the classification results, showing the number of true positives, true negatives, false positives, and false negatives.
8. Class Imbalance: Class imbalance is a problem that arises when one class (positive or negative) has significantly more instances than the other class. This can lead to biased classification models that are skewed towards the majority class. Strategies for addressing class imbalance include data preprocessing techniques such as oversampling, undersampling, and SMOTE, as well as model-based approaches such as cost-sensitive learning and class-weighted algorithms.
9. Precision-Recall Curve: The precision-recall curve is another graphical representation of classification results, which can be more informative than the ROC curve in situations with imbalanced data. It plots precision against recall for different classification thresholds.
10. Cross-validation: Cross-validation is a technique used to evaluate the performance of a classification model and to compare different models. It involves partitioning the dataset into k subsets, training the model on k-1 subsets, and testing it on the remaining subset. This process is repeated for all k subsets, and the mean performance across all k runs is used as the performance metric for the model.
Examples
Conclusion
Overall, metrics for classification models are important for assessing the performance of a model. They provide insight into the accuracy, precision, recall, and F1 score of a model, as well as the ROC curve and AUC score. These metrics help to compare the performance of different models and guide the selection of the best model. Additionally, they can be used to detect overfitting and guide the optimization of model parameters.
Key takeaways
Quiz
1. Which of the following metrics can be used to measure the performance of a classification model?
Answer: A. AUC-ROC score, B. F1 score
2.What does the Area Under the Curve (AUC) measure?
Answer: C. Model performance
3.What is the purpose of the confusion matrix?
Answer: C. To identify the correct and incorrect predictions made by the model
4.What is the purpose of the precision and recall metric?
Answer: B. To identify the correct and incorrect predictions made by the model
Top Tutorials

Python
Python is a popular and versatile programming language used for a wide variety of tasks, including web development, data analysis, artificial intelligence, and more.

SQL
The SQL for Beginners Tutorial is a concise and easy-to-follow guide designed for individuals new to Structured Query Language (SQL). It covers the fundamentals of SQL, a powerful programming language used for managing relational databases. The tutorial introduces key concepts such as creating, retrieving, updating, and deleting data in a database using SQL queries.

Applied Statistics
Master the basics of statistics with our applied statistics tutorial. Learn applied statistics techniques and concepts to enhance your data analysis skills.
All Courses (6)
Master's Degree (2)
Fellowship (2)
Certifications (2)


