Your Success, Our Mission!
6000+ Careers Transformed.
Overview
K-Nearest Neighbors (KNN) is a supervised machine learning algorithm that is used for both classification and regression. The algorithm is based on the idea that the data points that are closest to a given data point are the most likely to be similar to it. KNN works by finding the k-nearest points in the training data set and then using the labels of those points to predict the label of the given data point. KNN is considered an instance-based learning algorithm, since it stores the training data and makes predictions based on the stored data points.
Introduction to K-Nearest Neighbors (KNN)
K-nearest neighbors (kNN) is a supervised machine learning algorithm that can be used to solve both classification and regression tasks. kNN as an algorithm seems to be inspired from real life. People tend to be effected by the people around them.
It works in a similar fashion to humans as our behaviour is guided by the friends we grew up with or from our surroundings. If you grow up with people who love sports, it is highly likely that you will end up loving sports. Our parents also shape our personality in some ways. There are of-course exceptions.
kNN classifier determines the class of a data point by majority voting principle. If k is set to 5, the classes of 5 closest points are checked. Prediction is done according to the majority class. Similarly, kNN regression takes the mean value of 5 closest points.
KNN-Algorithm
Load the data
Initialize K to your chosen number of neighbors’ and normalize the data.
For each example in the data
3.1. Calculate the distance between the query example and the current example from the data.
3.2. Add the distance and the index of the example to an ordered collection
Sort the ordered collection of distances and indices from smallest to largest (in ascending order) by the distances
Pick the first K entries from the sorted collection
Get the labels of the selected K entries
If regression, return the mean of the K labels
If classification, return the mode of the K labels
Example:
Suppose we have a dataset which can be plotted as follows −
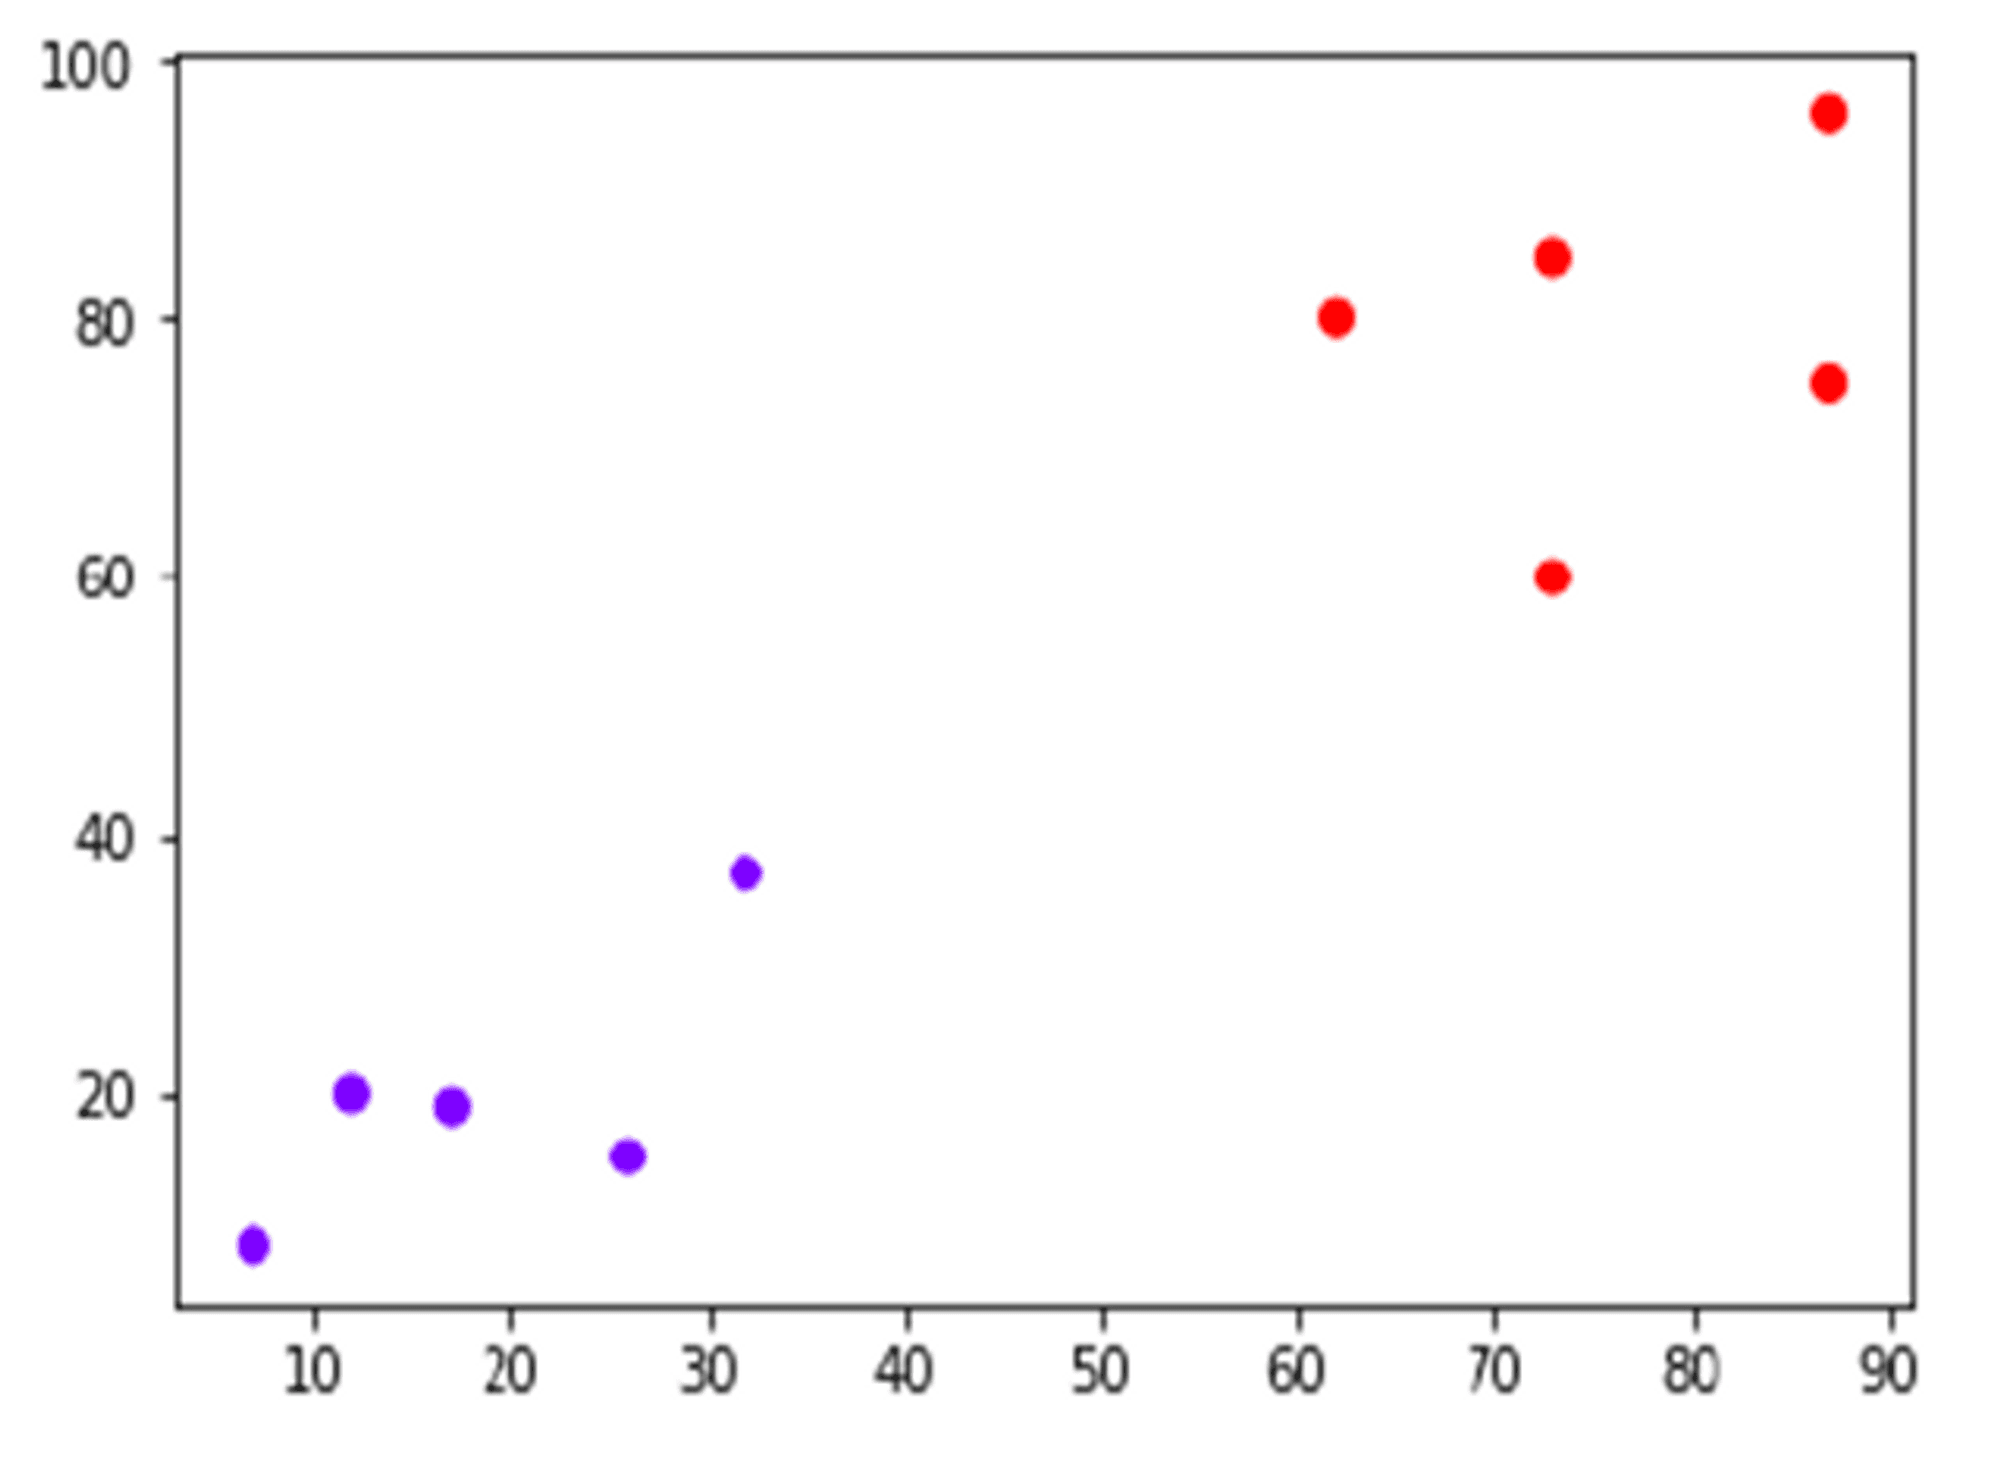
Now, we need to classify new data point with black dot (at point 60,60) into blue or red class. We are assuming K = 3 i.e. it would find three nearest data points.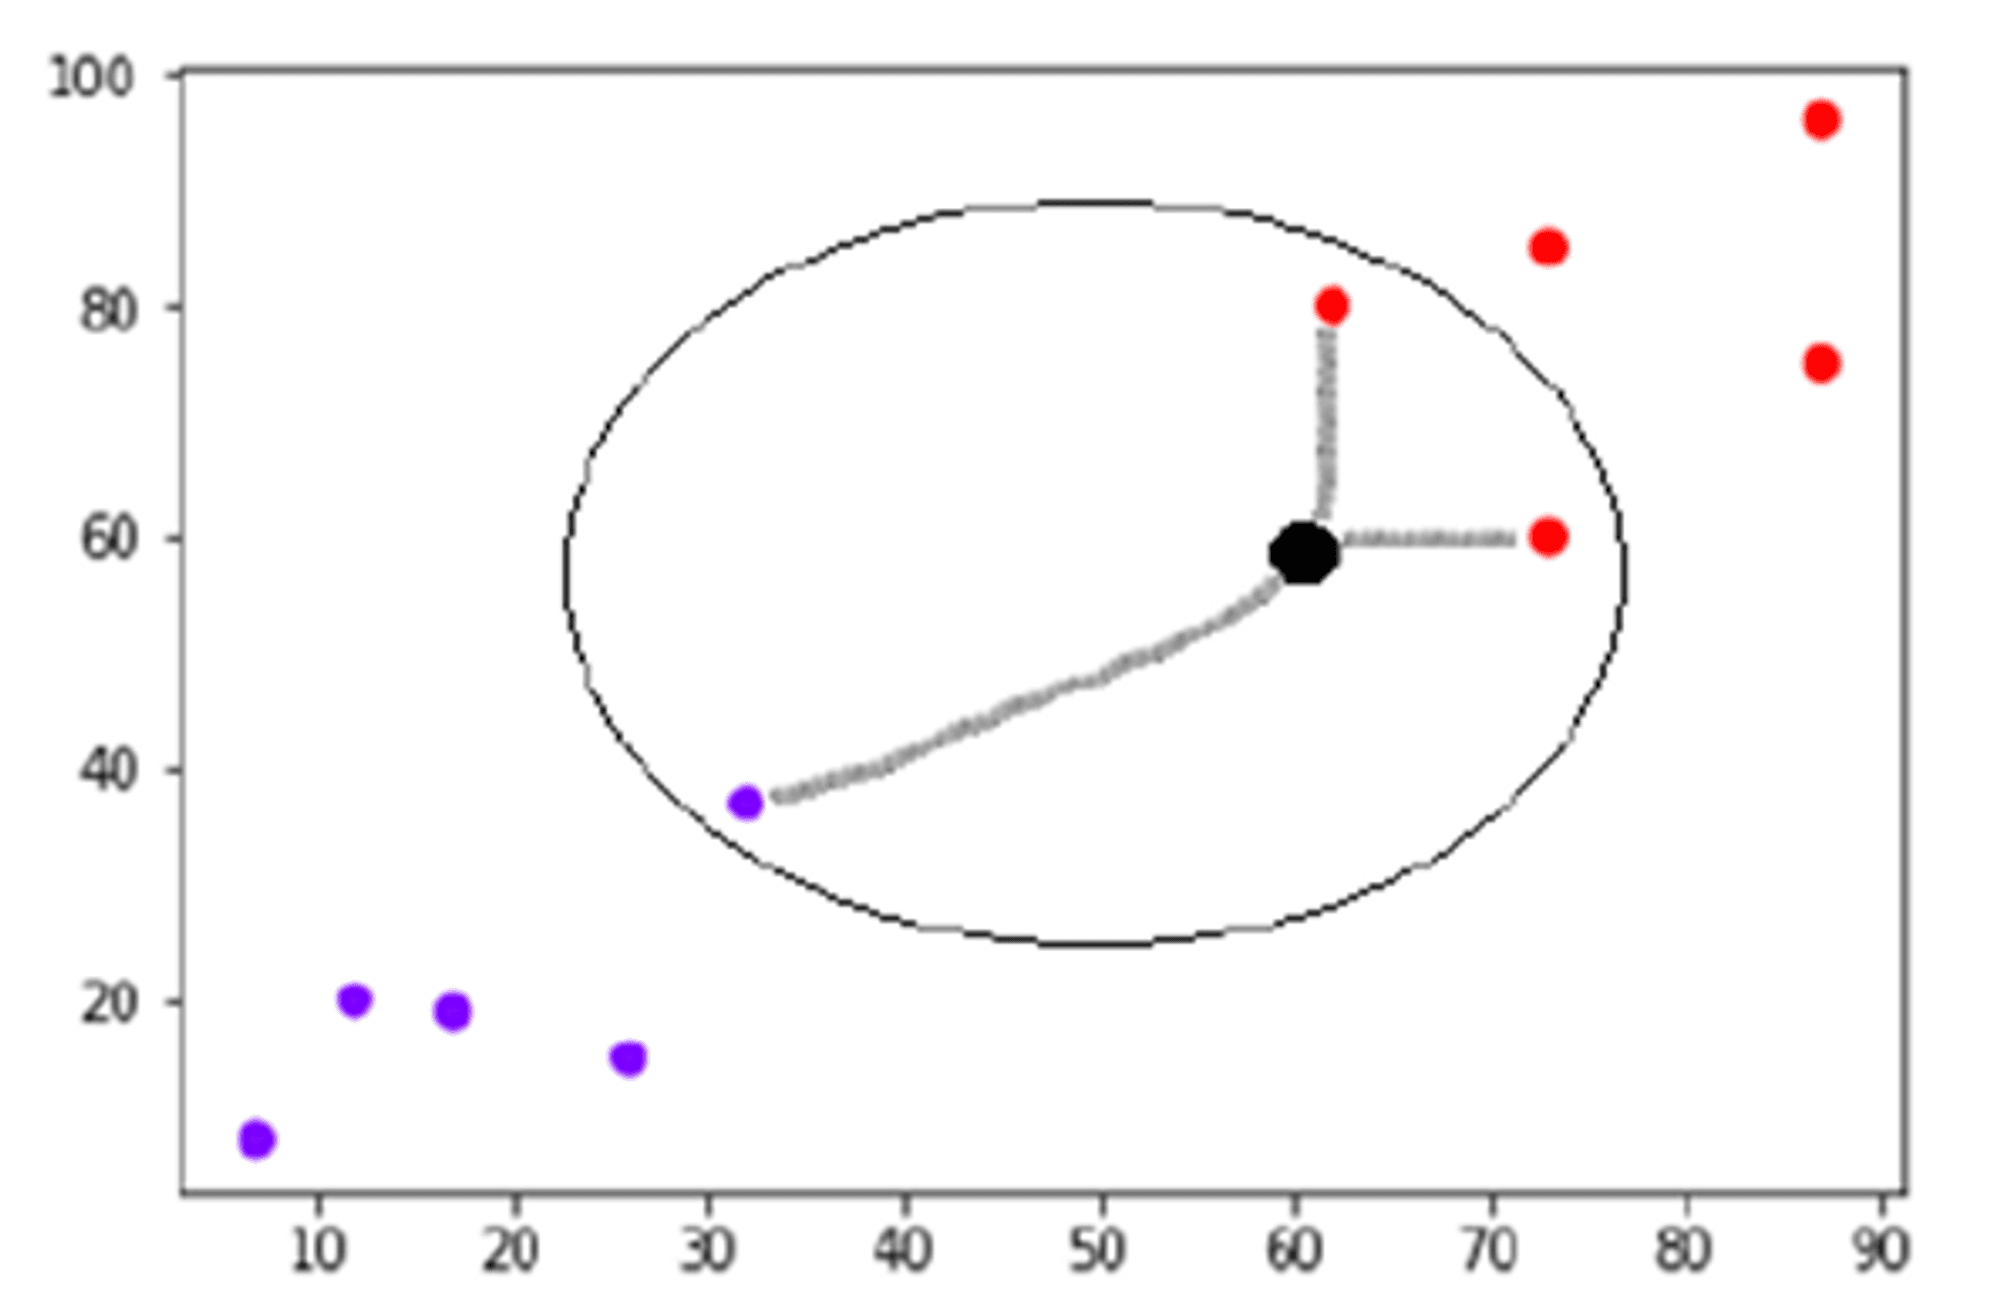
How to select the best value of K
Example:
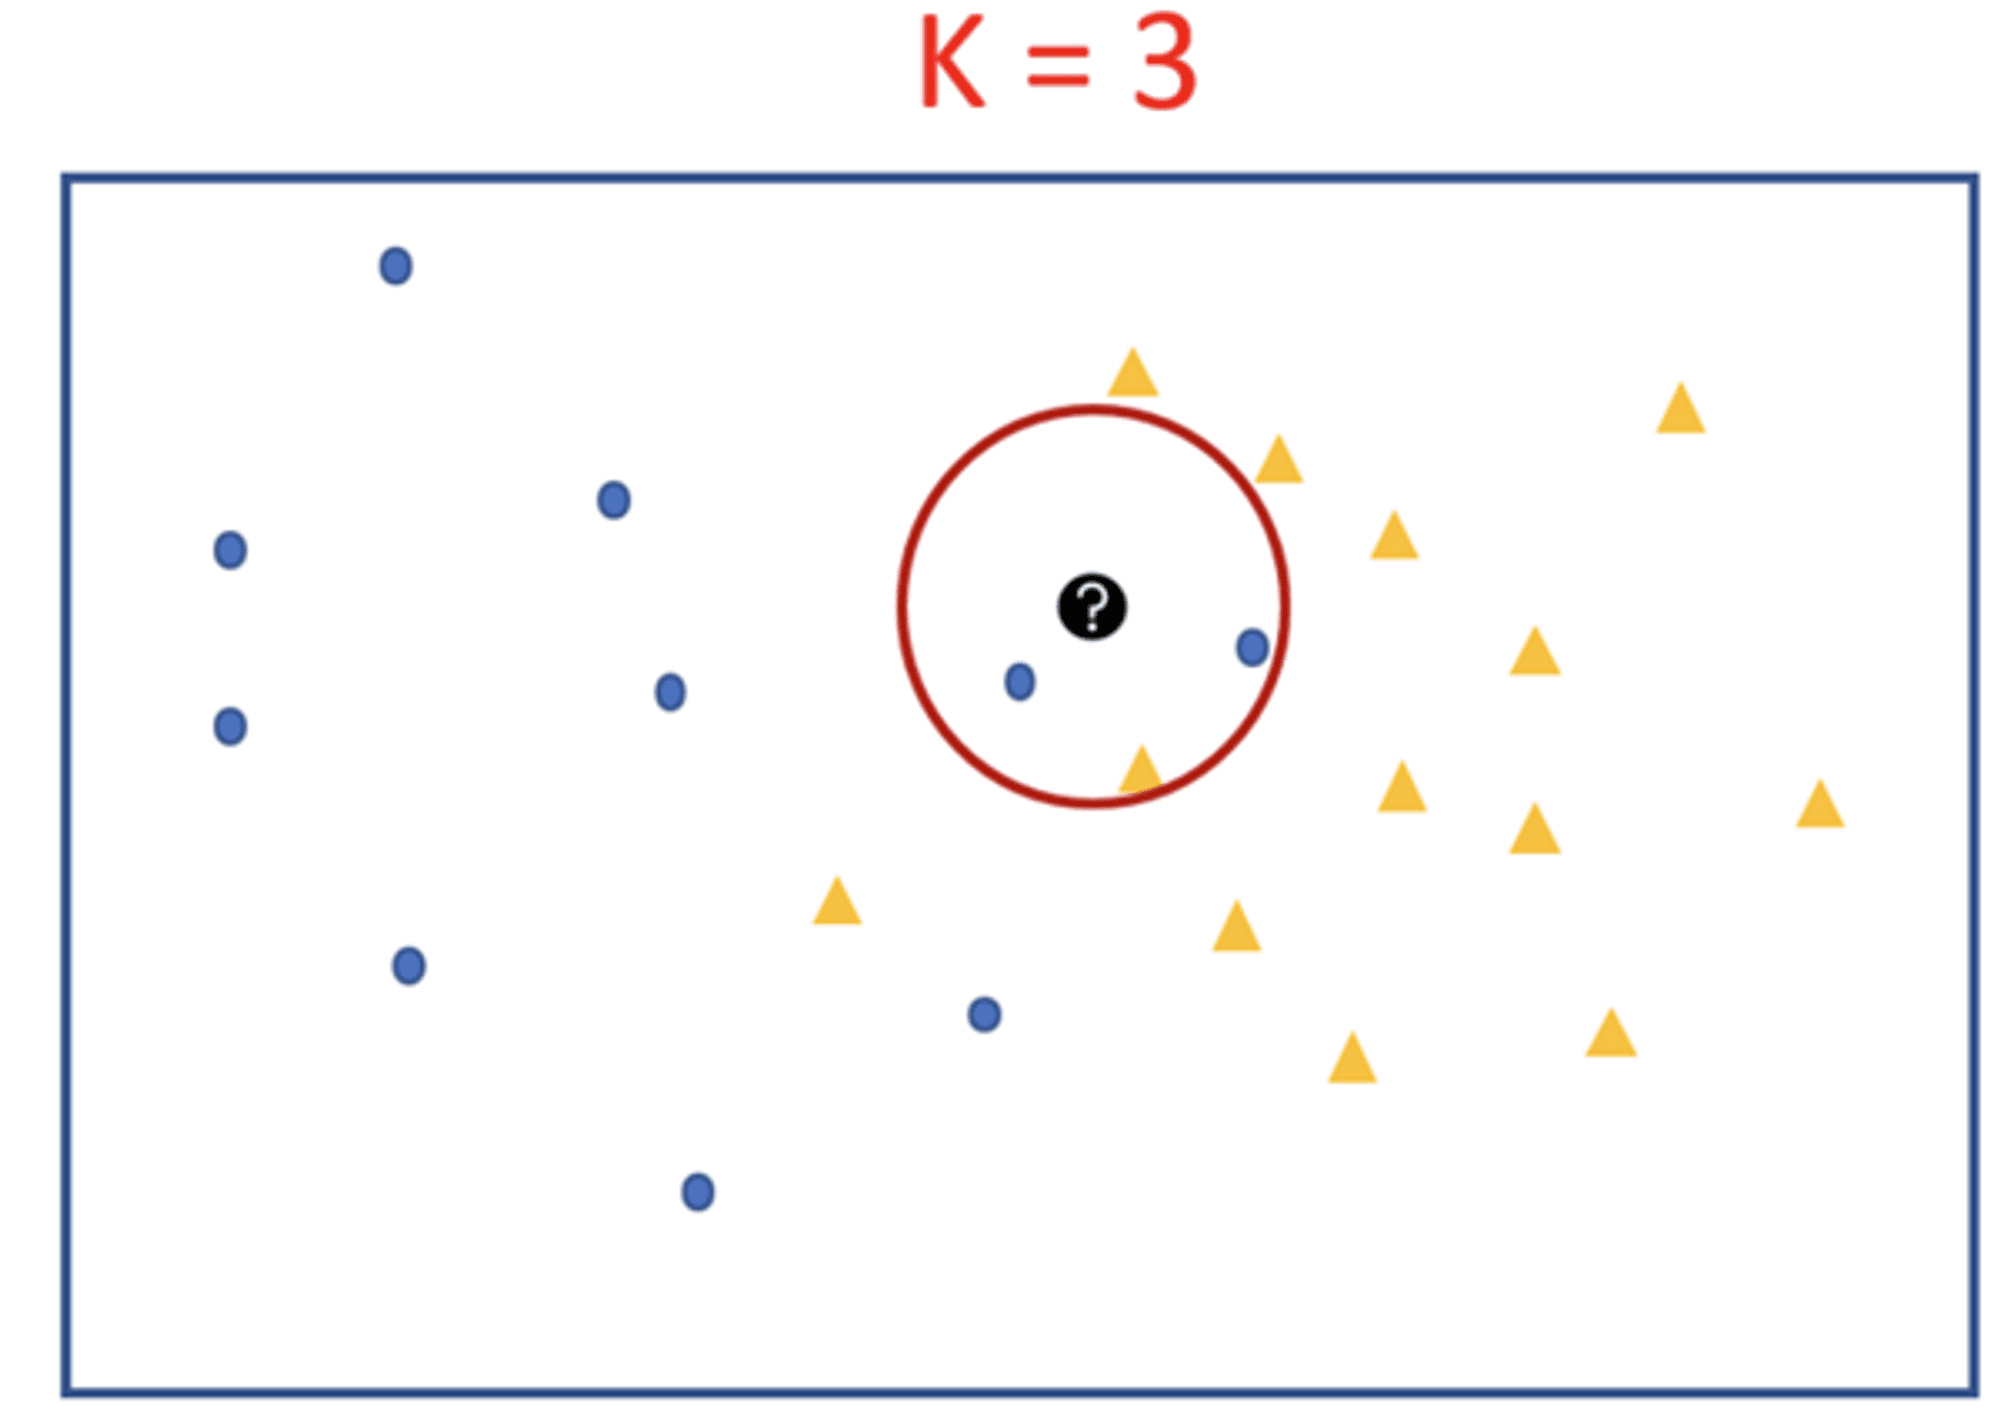
Let’s say we have two groups of points —blue-circles and orange-triangles. We want to classify the Test Point = black circle with a question mark, as either a blue circle or an orange triangle.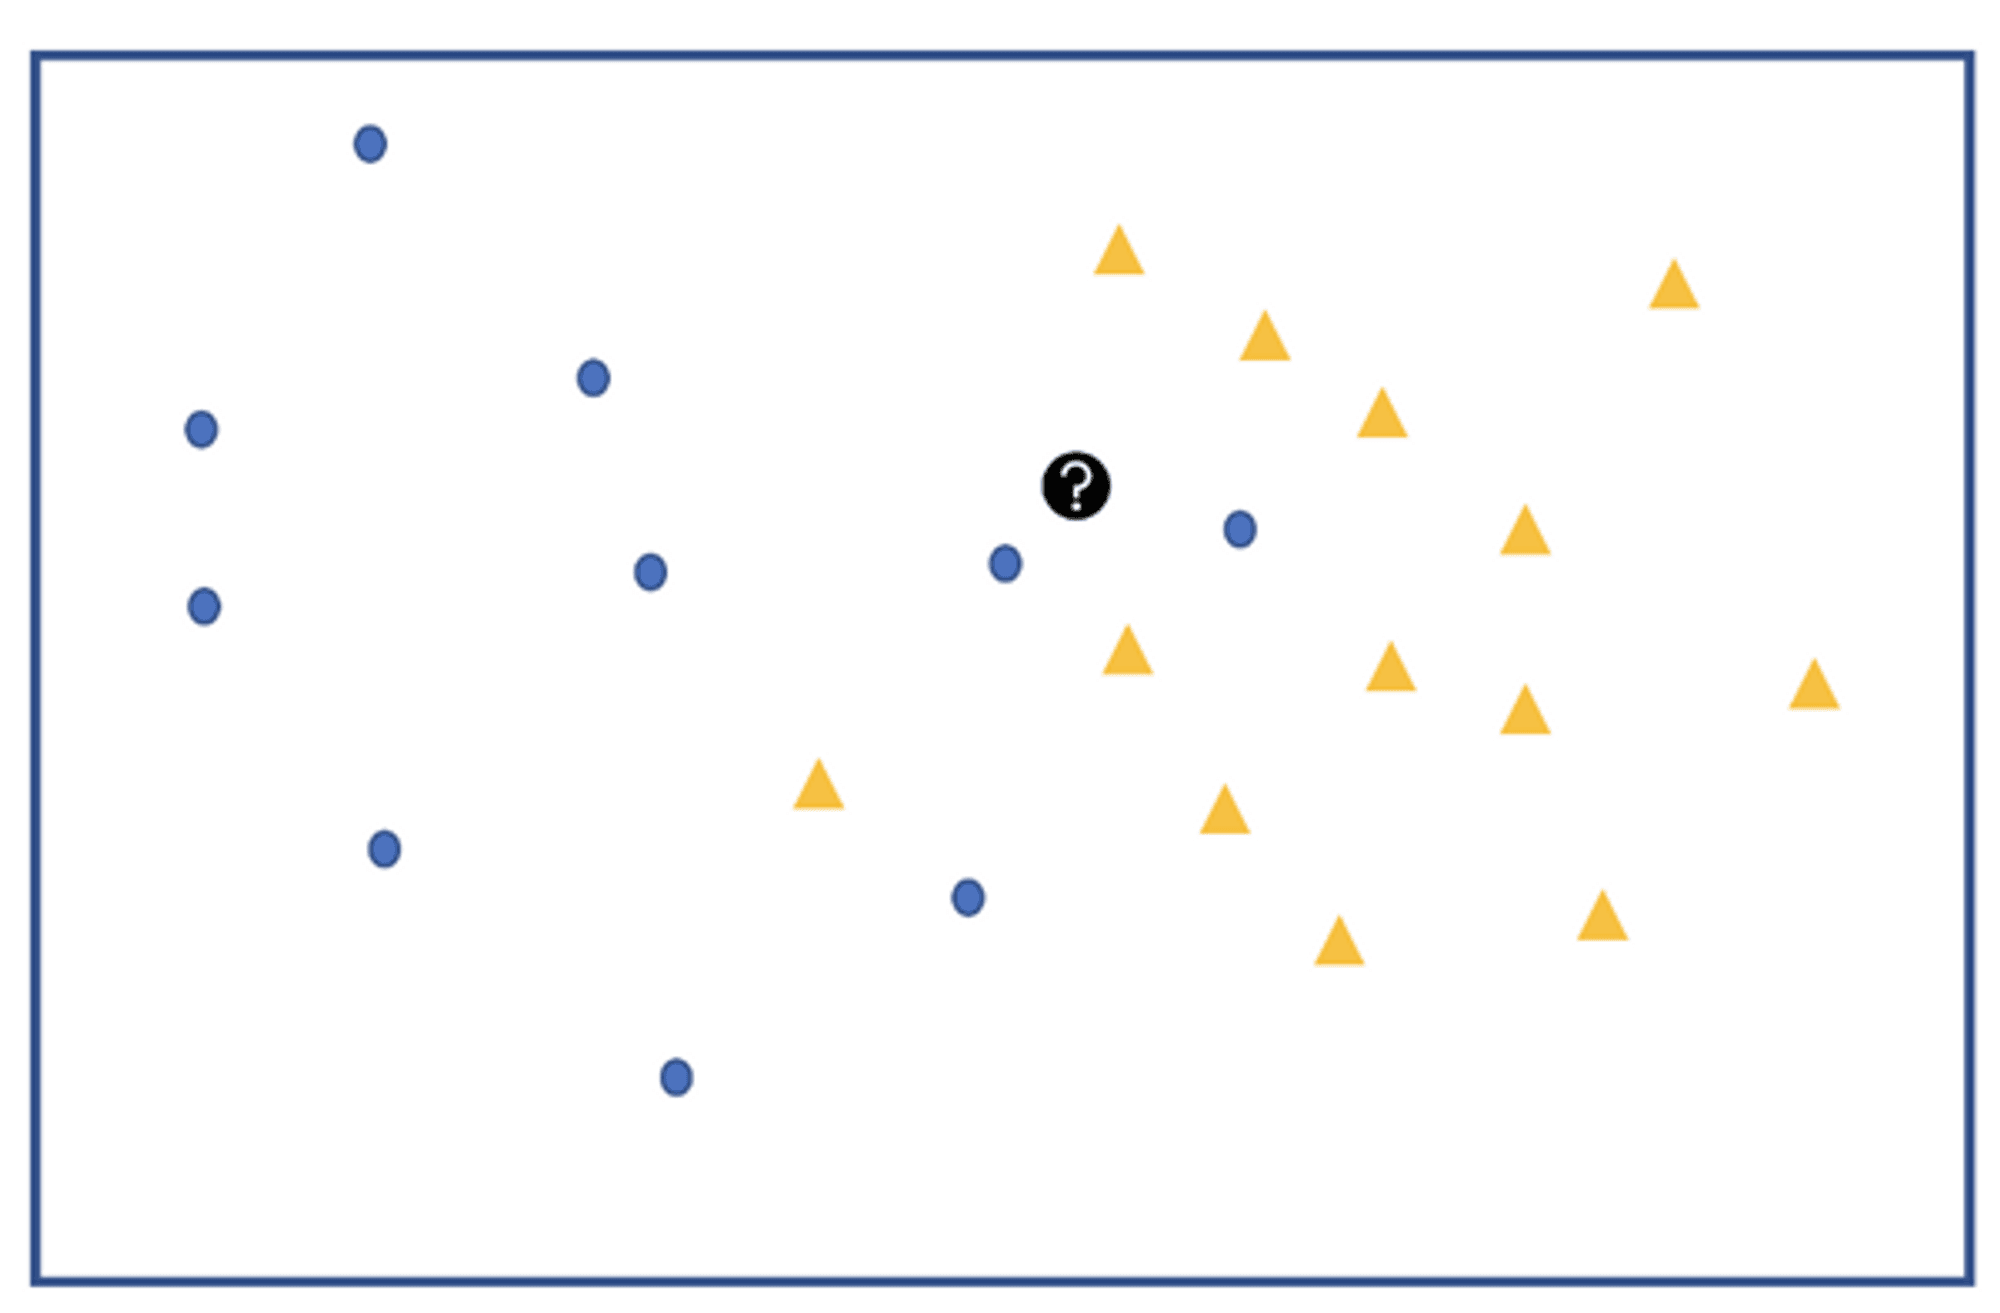
For K = 1 we will look at the first nearest neighbor. Since we take majority vote and there is only 1 voter we assign its label to our black test point. We can see that the test point will be classified as a blue circle for k=1.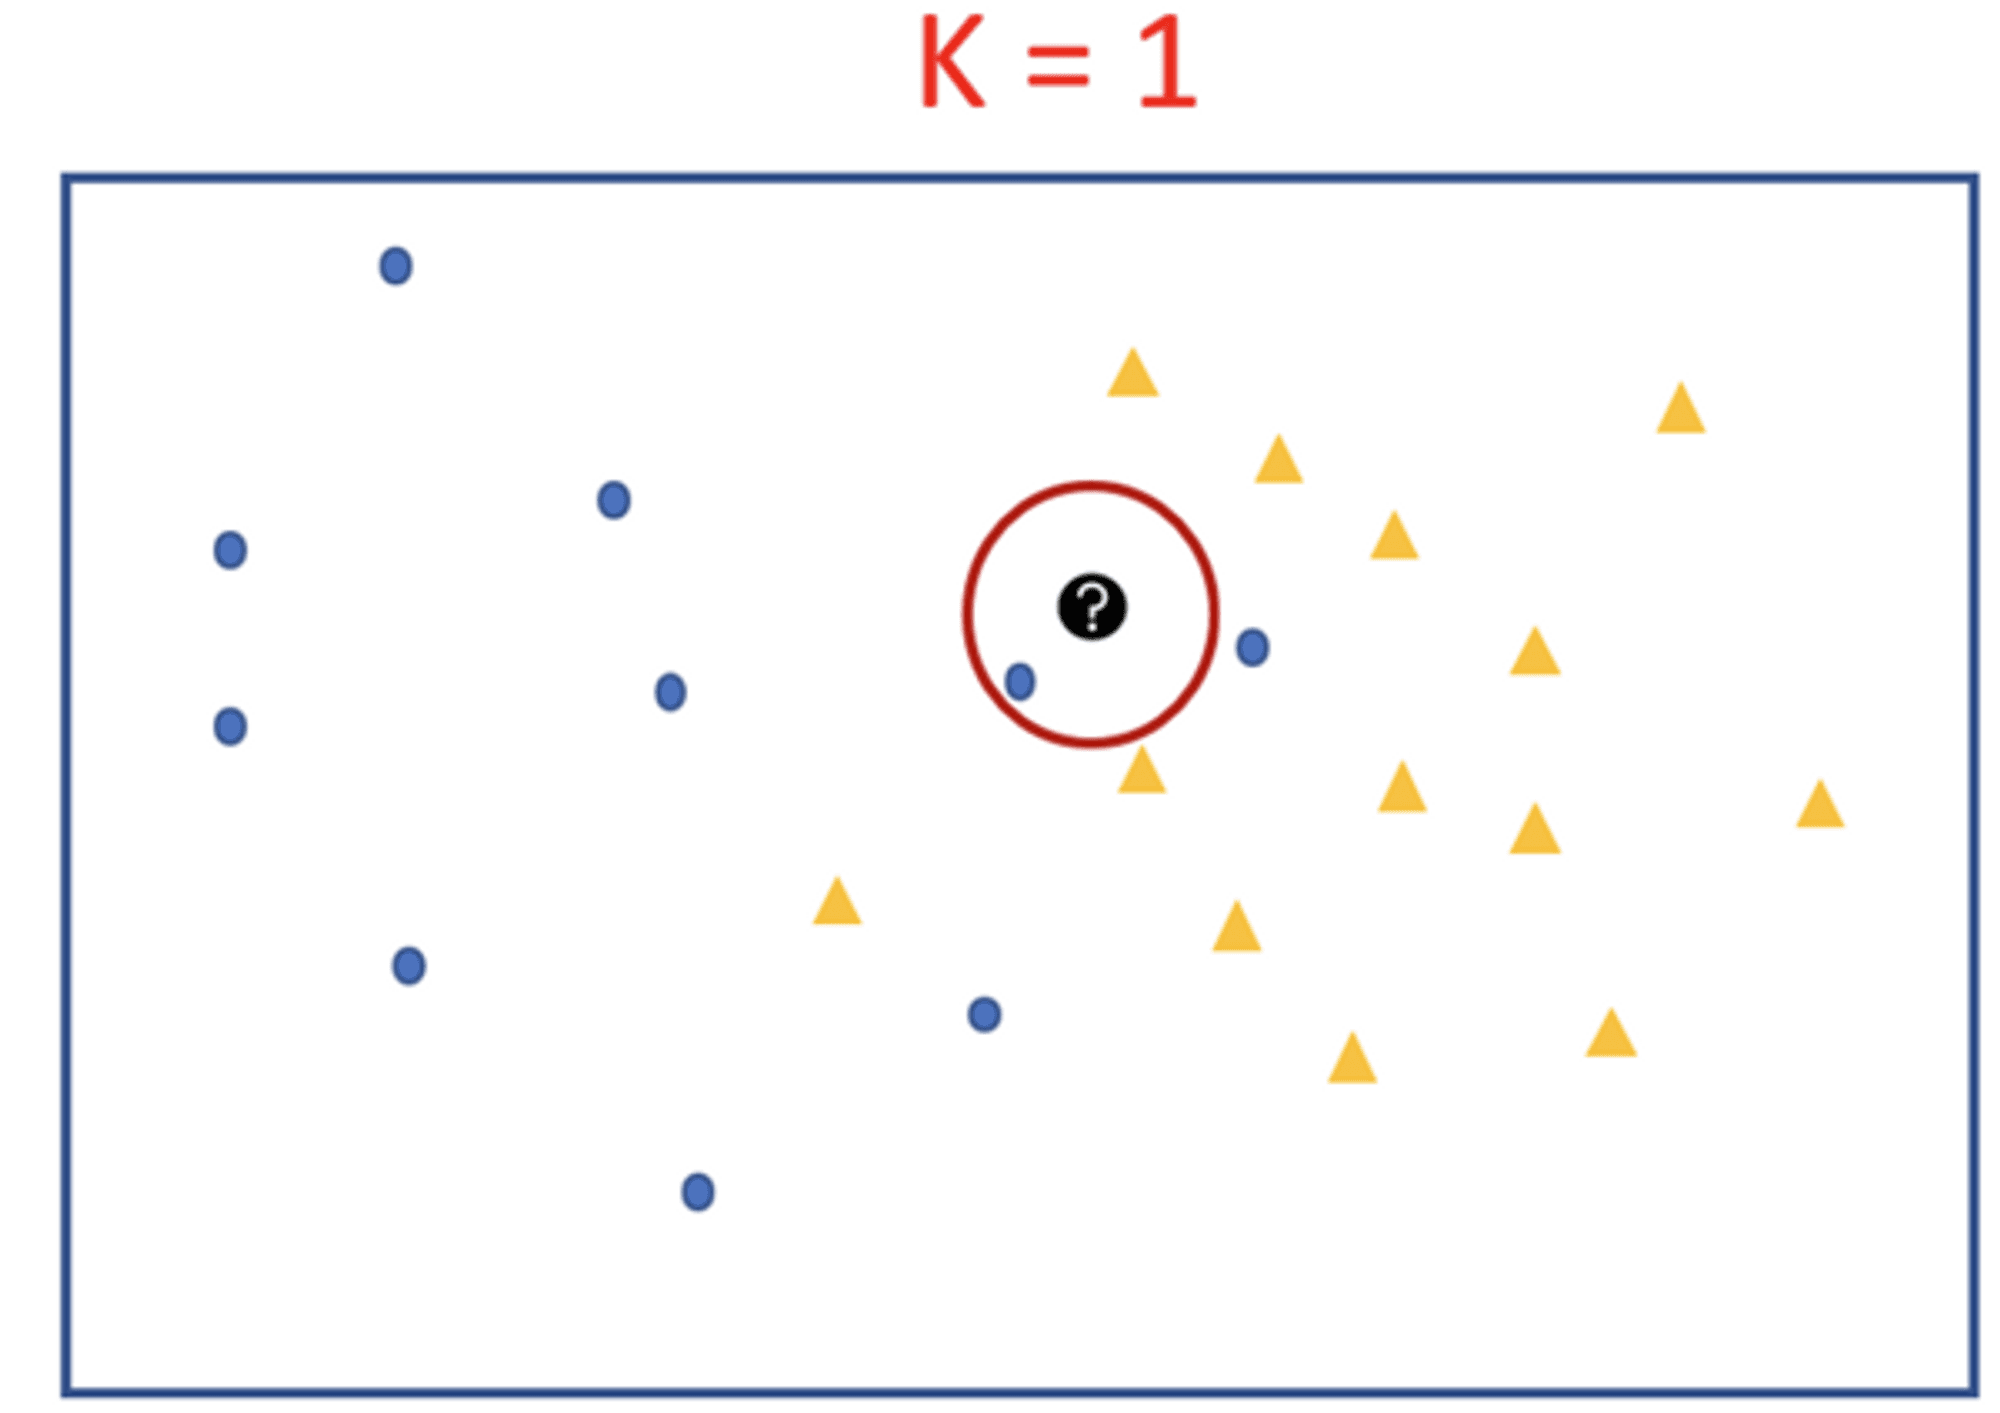
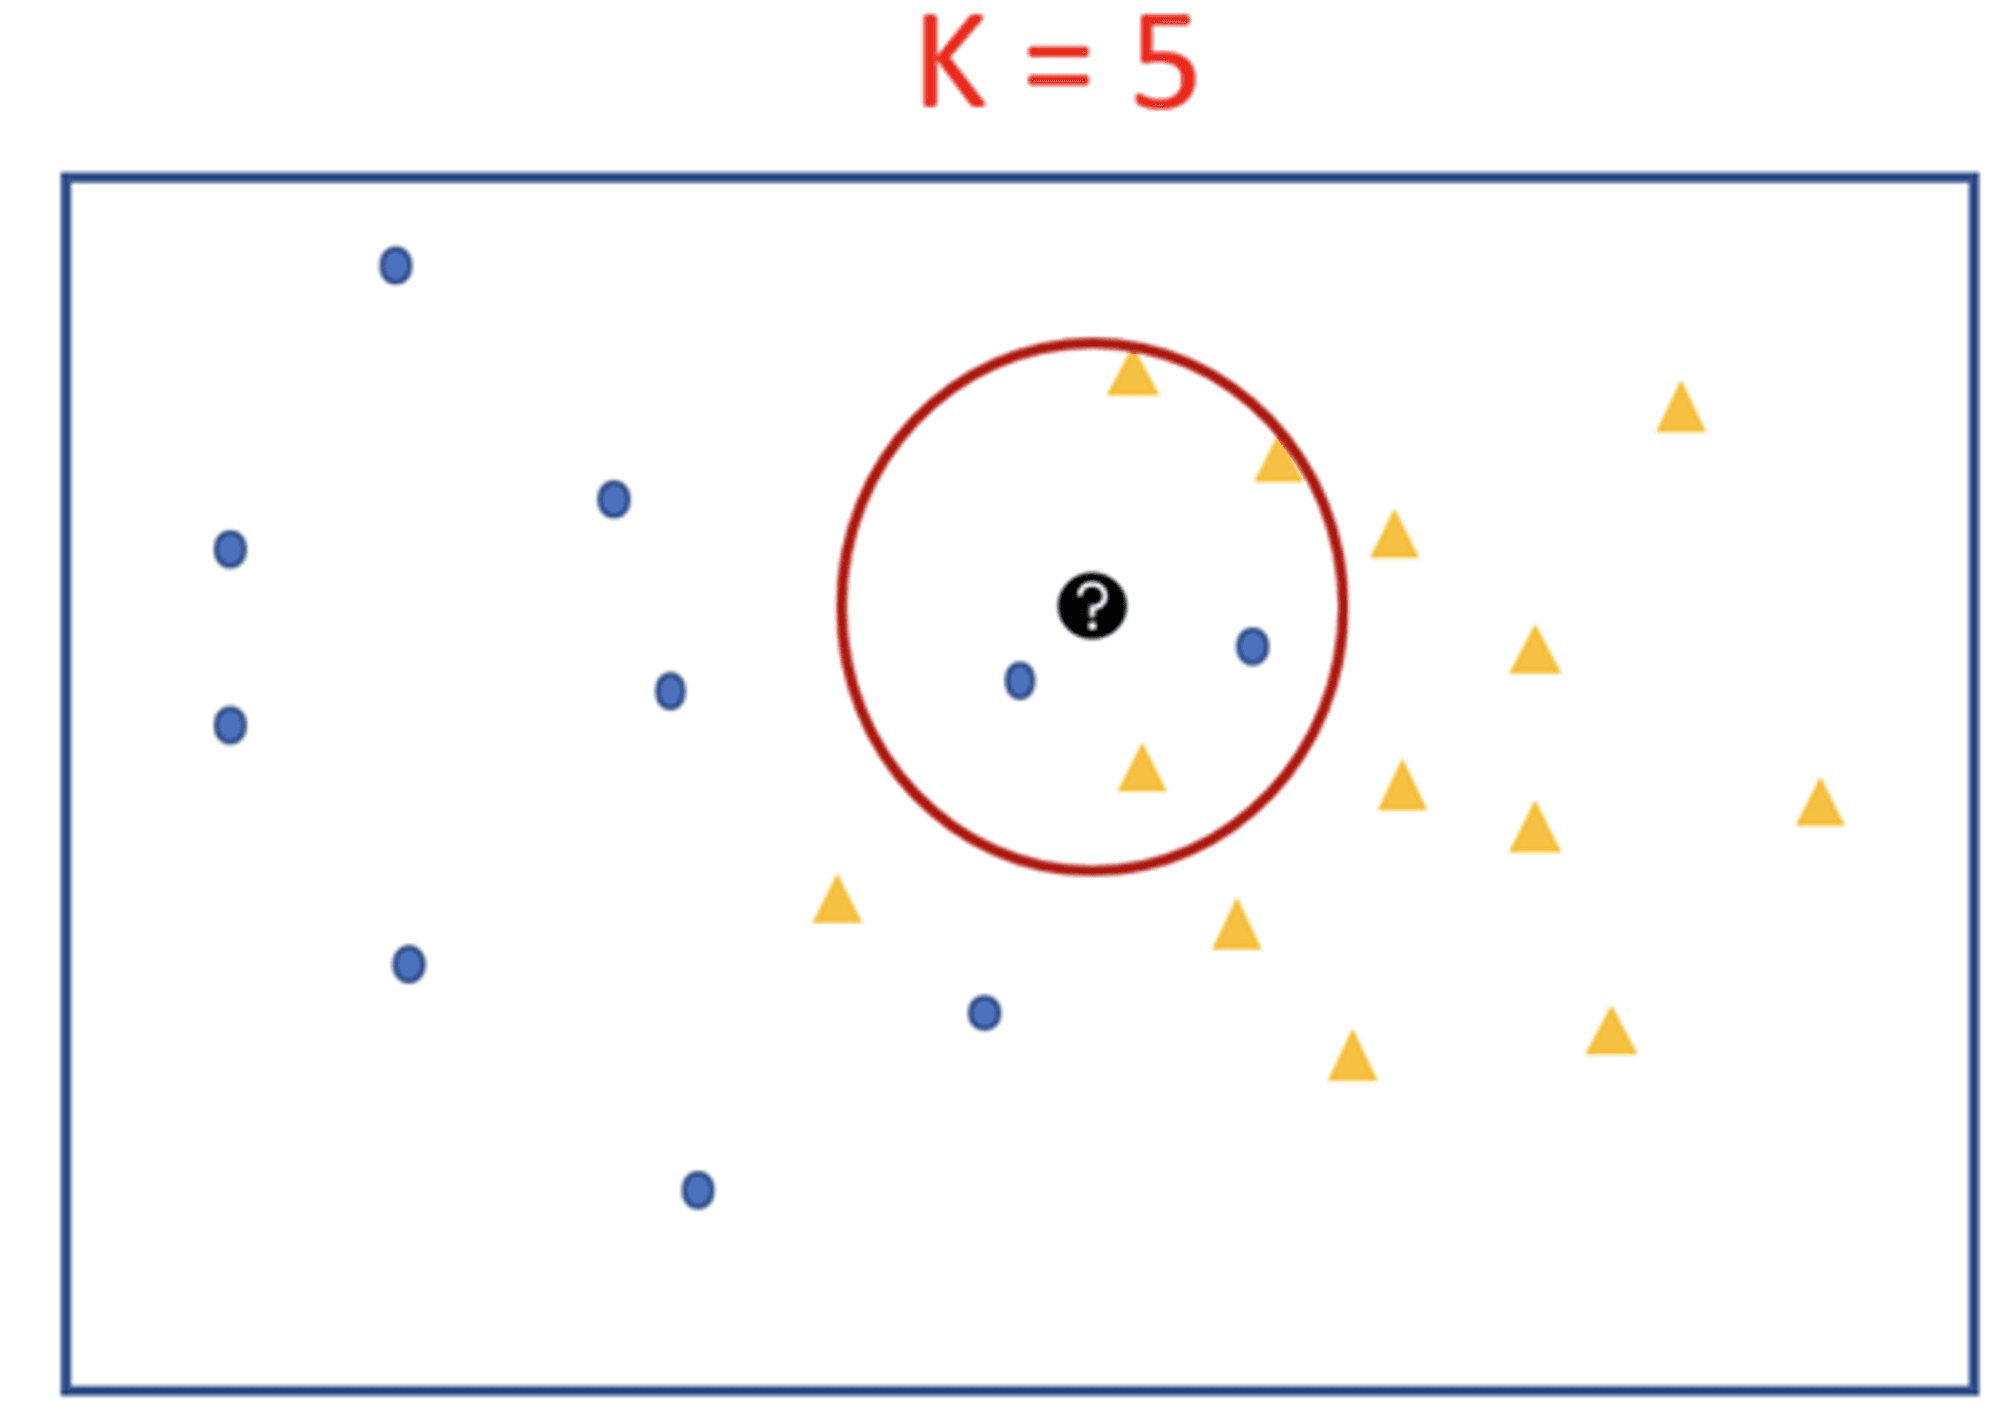
If K is very Large: The class label of the majority class of the training data set will be assigned to the rest data regardless of the class labels of the neighbours nearest to the test data.
If K is very Small: The class value of a noisy data/outlier in the training dataset which is the nearest neighbor to the test data will be assigned to the test data.
The best value of K is somewhere between these to extremes.
Set K = square root of the number of training records.
Test several K values on a variety of test data sets and choose the one that gives best performance.
Distance metrics:
Euclidean Distance is a measure of the straight-line distance between two points in a Euclidean space. It is calculated by taking the square root of the sum of the squared differences between each coordinate of the two points. Mathematically, it is represented by the equation: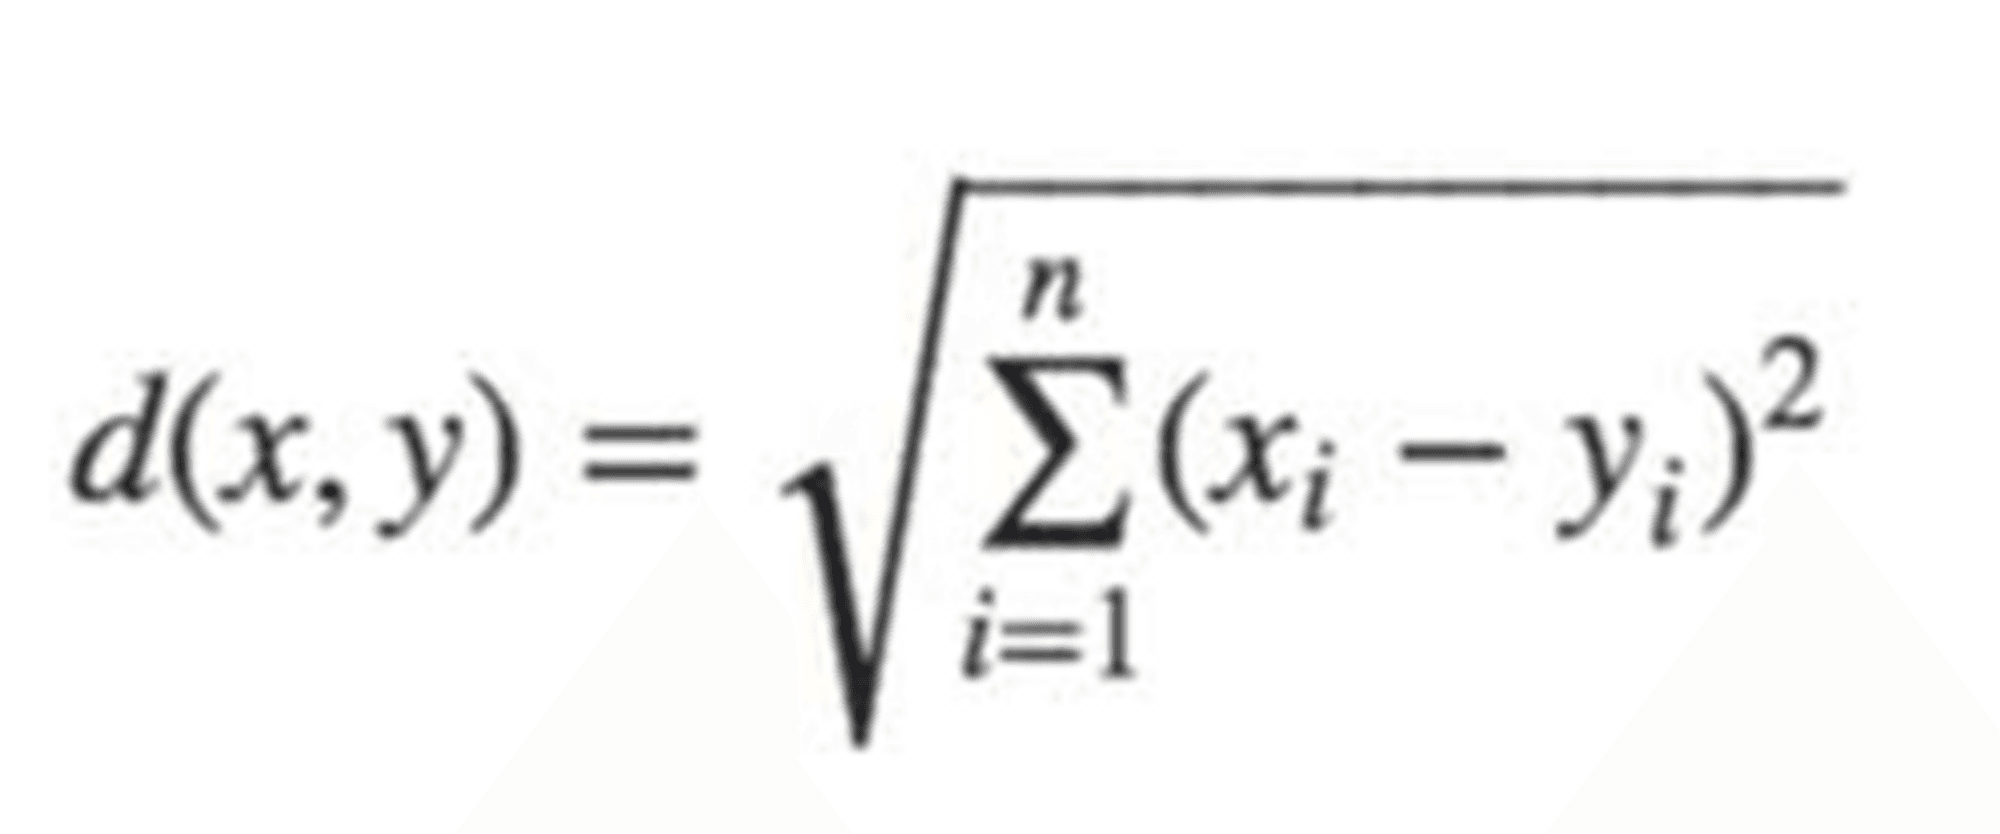
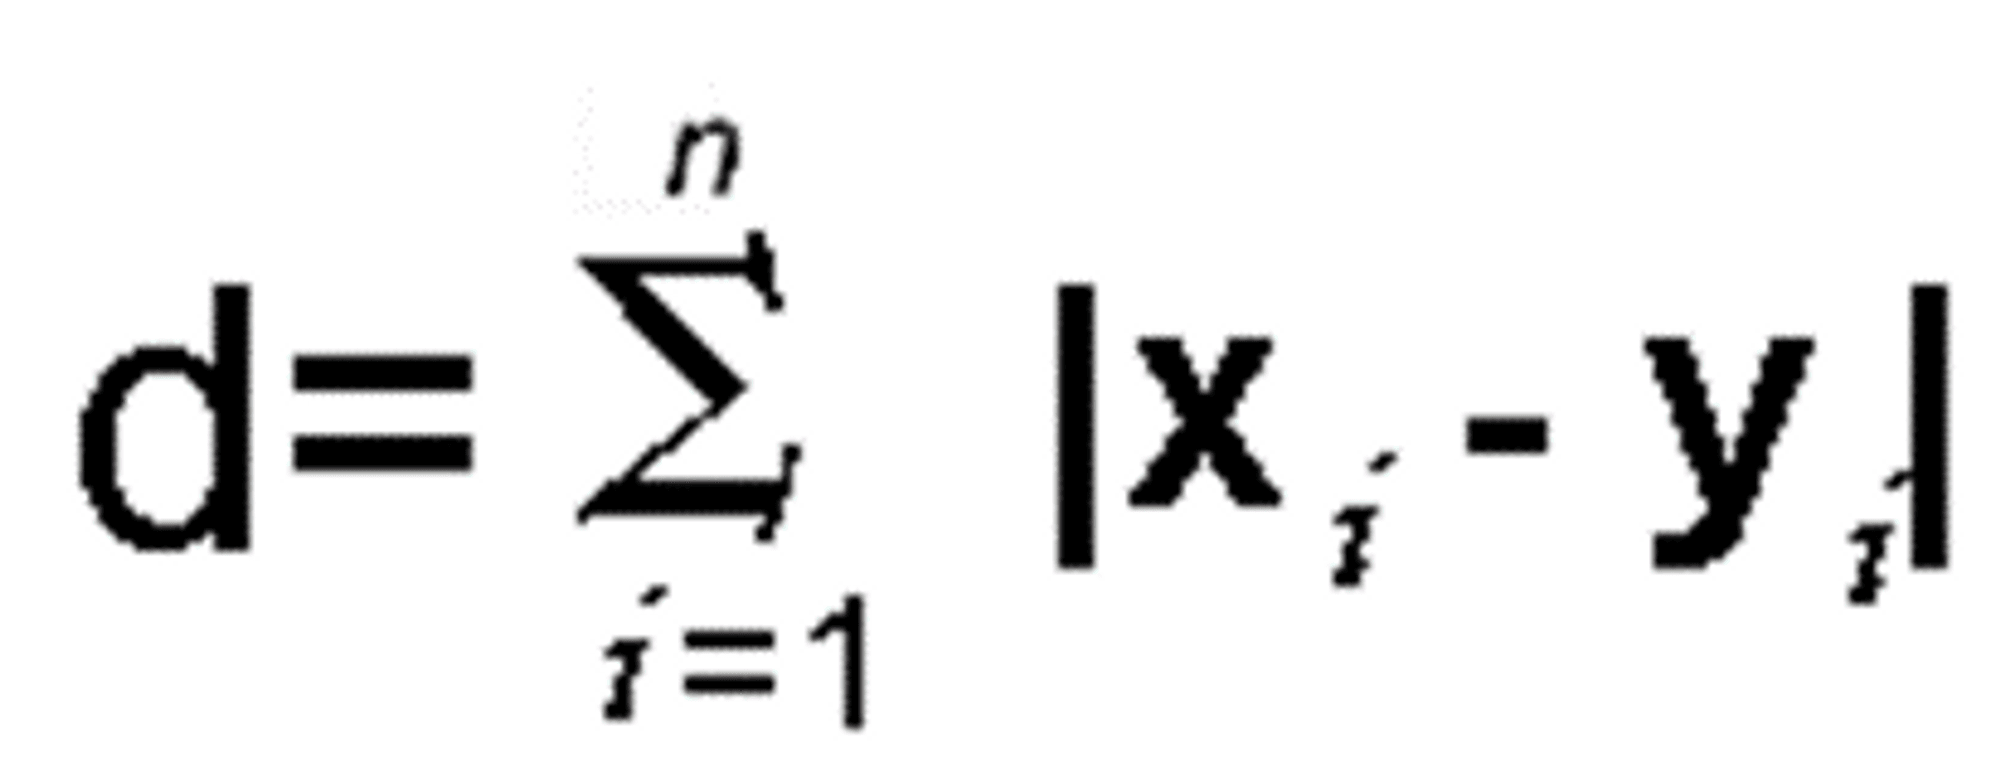
Manhattan Distance, also known as Taxicab Distance, is a measure of the distance between two points in a rectangular grid. It is calculated by taking the sum of the absolute differences between the two points for each coordinate. Mathematically, it is represented by the equation:
Feature scaling
Feature scaling is a process used to normalize the range of independent variables or features of data. In machine learning, it is important to scale the features in the dataset prior to training a model, since the range of values of raw data varies widely. Scaling helps to reduce the time it takes to converge and improve the accuracy of the KNN model. Some popular feature scaling techniques include Min-Max scaling, Standardization, and Normalization.
Normalization_vs_Standardization
Xscaled = (X−Xmean)/S
where X is an original value, Xmean is the mean of all the values in the feature, and S is the standard deviation of all the values in the feature.
2. Normalization: This technique re-scales a feature or dataset to have a range between 0 and 1. The formula is given by
Xscaled = (X−Xmin)/(Xmax−Xmin)
where X is an original value, Xmin is the minimum value of X in the feature, and Xmax is the maximum value of X in the feature.
Advantages and disadvantages of KNN
PROS
CONS
Implementing KNN in Python
For this example, we will use the classic Iris dataset which contains measurements for 150 flowers from three different species: Setosa, Versicolor, and Virginica. The dataset contains four features: sepal length, sepal width, petal length, and petal width.
Link: https://www.kaggle.com/datasets/uciml/iris
This code implements the K-Nearest Neighbors (KNN) algorithm on the Iris dataset. First, the required libraries are imported. Then, the dataset is loaded and split into features (X) and labels (y). The dataset is then split into a training and test set. The KNN classifier is then initialized and the model is trained using the training set. Finally, the model is used to make predictions on the test set and the accuracy is evaluated.
Real-world applications of KNN
Conclusion
After using the K Nearest Neighbors machine learning algorithm, the retail store was able to more accurately identify customers who were likely to purchase a particular product based on their past purchasing behavior. This allowed them to better target customers with the right products and offers, leading to increased sales and profits.
Key takeaways
Quiz
1.Which of the following is a disadvantage of KNN?
Answer: D. All of the Above
2.Which of the following is a key feature of KNN?
Answer: A. Non-parametric learning
3.Which of the following is an advantage of KNN?
Answer: D. All of the Above
4.What type of learning algorithm is KNN?
Answer: A. Supervised learning
Top Tutorials

Python
Python is a popular and versatile programming language used for a wide variety of tasks, including web development, data analysis, artificial intelligence, and more.

SQL
The SQL for Beginners Tutorial is a concise and easy-to-follow guide designed for individuals new to Structured Query Language (SQL). It covers the fundamentals of SQL, a powerful programming language used for managing relational databases. The tutorial introduces key concepts such as creating, retrieving, updating, and deleting data in a database using SQL queries.

Applied Statistics
Master the basics of statistics with our applied statistics tutorial. Learn applied statistics techniques and concepts to enhance your data analysis skills.
All Courses (6)
Master's Degree (2)
Fellowship (2)
Certifications (2)


