Your Success, Our Mission!
6000+ Careers Transformed.
Overview
Logistic regression is a statistical technique used to model the relationship between a dependent variable and one or more independent variables. It is used for binary classification problems where the target variable can take two values (usually 0 and 1). Unlike linear regression, which is used to predict continuous values, logistic regression predicts the likelihood of contracting a particular disease based on symptoms or predict the likelihood of repaying a loan based on financial history.
Introduction to logistic regression
A company has to foresee how likely its clients are to buy a modern item. To do this, the company collects information about its customers' socioeconomics, purchase history, and other critical characteristics. They at that point utilize logistic regression to analyze this information and produce a forecast of whether or not each client will purchase the unused item. This forecast is based on the probability that clients with comparable characteristics will react emphatically to the item. The company can at that point utilize this data to target its showcasing endeavors and center on clients that are more likely to purchase the product.
Logistic regression could be a sort of supervised machine learning classification algorithm used to foresee the likelihood of a categorical dependent variable. It may be an extraordinary case of linear regression where the target variable is categorical in nature. The condition for logistic regression is given:
P(y=1|x) = e^(b0 + b1x1 + b2x2 + ... + bnxn)/1+e^(b0 + b1x1 + b2x2 + ... + bnxn)
Where P(y=1|x) is the likelihood that y is equal to 1 given x, b0 is the captured, b1 to bn are the coefficients related to the independent factors x1 to xn, and e is the common exponential. The subordinate variable y can take on two values: 0 or 1
Understanding the logistic function and sigmoid curve
The logistic function and sigmoid curve are two related mathematical functions that are used in a variety of contexts, such as in machine learning, artificial neural networks, and probability theory. The logistic function is used to model the probability of an event occurring as a function of its input. It is defined by the equation.
f(x) = 1 / (1 + e^-x)
The sigmoid curve is a type of logistic function that is used to model the probability of an event occurring as a function of its input. It is defined by the equation
y = 1 / (1 + e^-x)
The logistic and sigmoid functions are related in that they both represent a nonlinear relationship between a variable x and a probability of an event occurring. The sigmoid curve is a logistic function more commonly used in machine learning and artificial neural networks.
Types of logistic regression
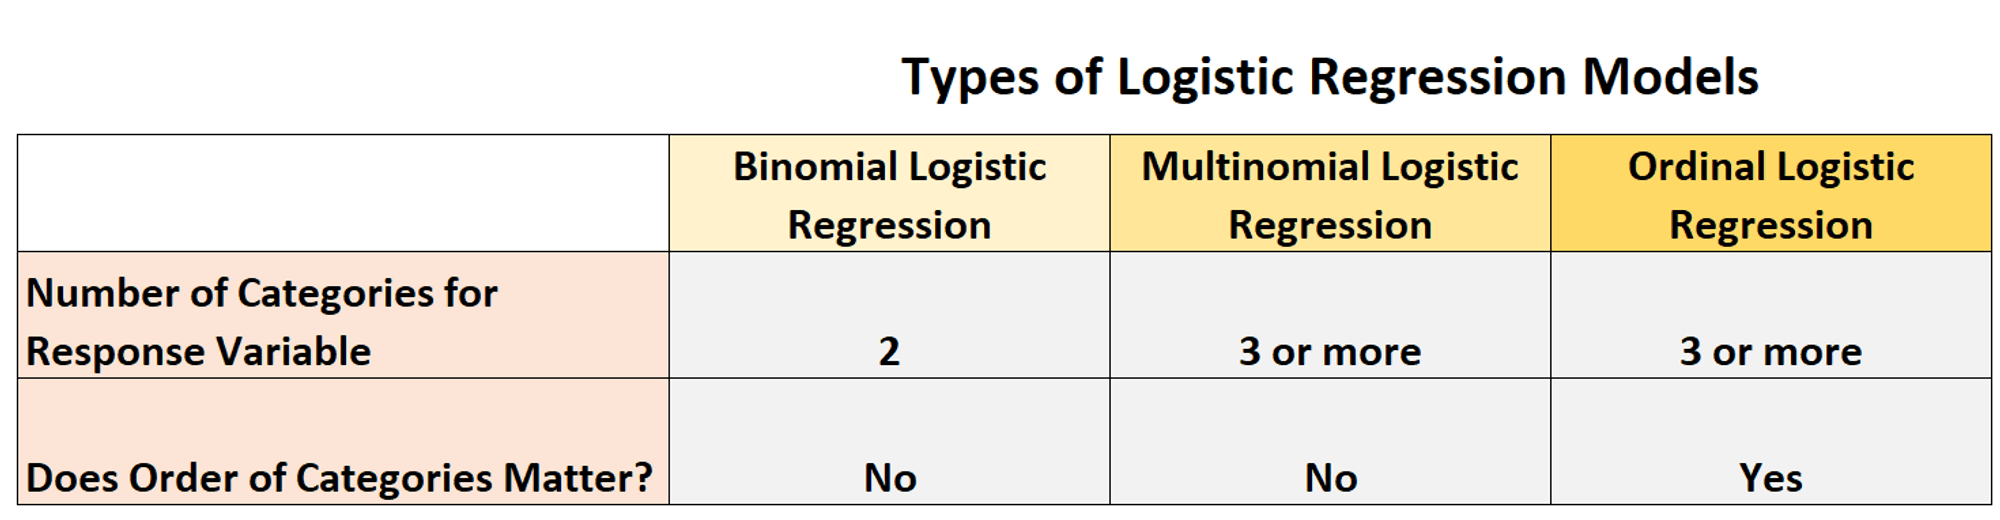
1. Binary logistic regression is used to predict a binary response variable from a set of predictor variables. It is a type of generalized linear model that uses a logistic function to model a binary dependent variable. The equation for binary logistic regression is given by:
P(Y=1|X) = 1/(1+e^(-β0-β1X1-β2X2...-βnXn))
This condition appears that the likelihood of the response variable is equal to 1 (Y=1) given the predictor variables (X) rise to 1 divided by 1 additionally the exponential of the entirety of the relapse coefficients (β0, β1, β2, etc.) multiplied by their respective predictor variables (X1, X2, etc.).
2. Multinomial logistic regression is utilized to anticipate a categorical response variable from a set of predictor variables. It could be a sort of generalized model that employs a multinomial logistic function to model a categorical subordinate variable. The condition for multinomial logistic regression is given by:
P(Y=k|X) =e^(β0k+β1X1+β2X2...+βnXn)/[1+e^(β01+β1X1+β2X2...+βnXn)+...+e^(β0K+β1X1+β2X2...+βnXn)]
3. Ordinal logistic regression is used to predict an ordinal response variable from a set of predictor variables. It is a type of generalized linear model that uses an ordinal logistic function to model an ordinal dependent variable. The equation for ordinal logistic regression is given by:
P(Y<=j|X) = 1/(1+e^(β0j-β1X1-β2X2...-βnXn))
This equation shows that the probability of the response variable is less than or equal to a particular category (j) given the predictor variables (X) is equal to 1 divided by 1 plus the exponential of the sum of the regression coefficients (β0, β1, β2, etc.) multiplied by their respective predictor variables (X1, X2, etc.) and the category value (j).
Maximum likelihood estimation and the likelihood function
Maximum likelihood estimation (MLE) is a statistical technique used to estimate the parameters of a given model based on observed data. It is a method that finds the set of parameters that maximizes the likelihood of observing the data.
The likelihood function is a function of the parameters given the data and is denoted as L(θ|x). Here, θ is a vector of parameters and x is the observed data. The likelihood is defined as the probability of observing the data given the parameters.
Mathematically, the likelihood function is expressed as:
L(θ|x) = p(x|θ)
where p(x|θ) is the probability of observing the data x given the parameters θ.
MLE is used to find the parameters that maximize the likelihood function. This is done by taking the partial derivative of the likelihood function with respect to the parameters and setting it equal to zero. This results in an equation that can be solved for the parameter values.
For example, for a normal distribution with mean μ and standard deviation σ, the likelihood function is given by:
L(μ,σ|x) = p(x|μ,σ) = (1/(σ √2π)) e^(-(x - μ)^2 / 2σ^2)
The parameters that maximize this likelihood function can be found by taking the partial derivatives of the likelihood with respect to μ and σ and setting them equal to zero:
∂L/∂μ = 0
and
∂L/∂σ = 0
Solving these equations yields the maximum likelihood estimates of the parameters:
μ = x (the mean is equal to the sample mean)

and

σ = (1/n)∑(x - μ)^2 (the standard deviation is equal to the sample
standard deviation).
Model fitting and coefficient interpretation
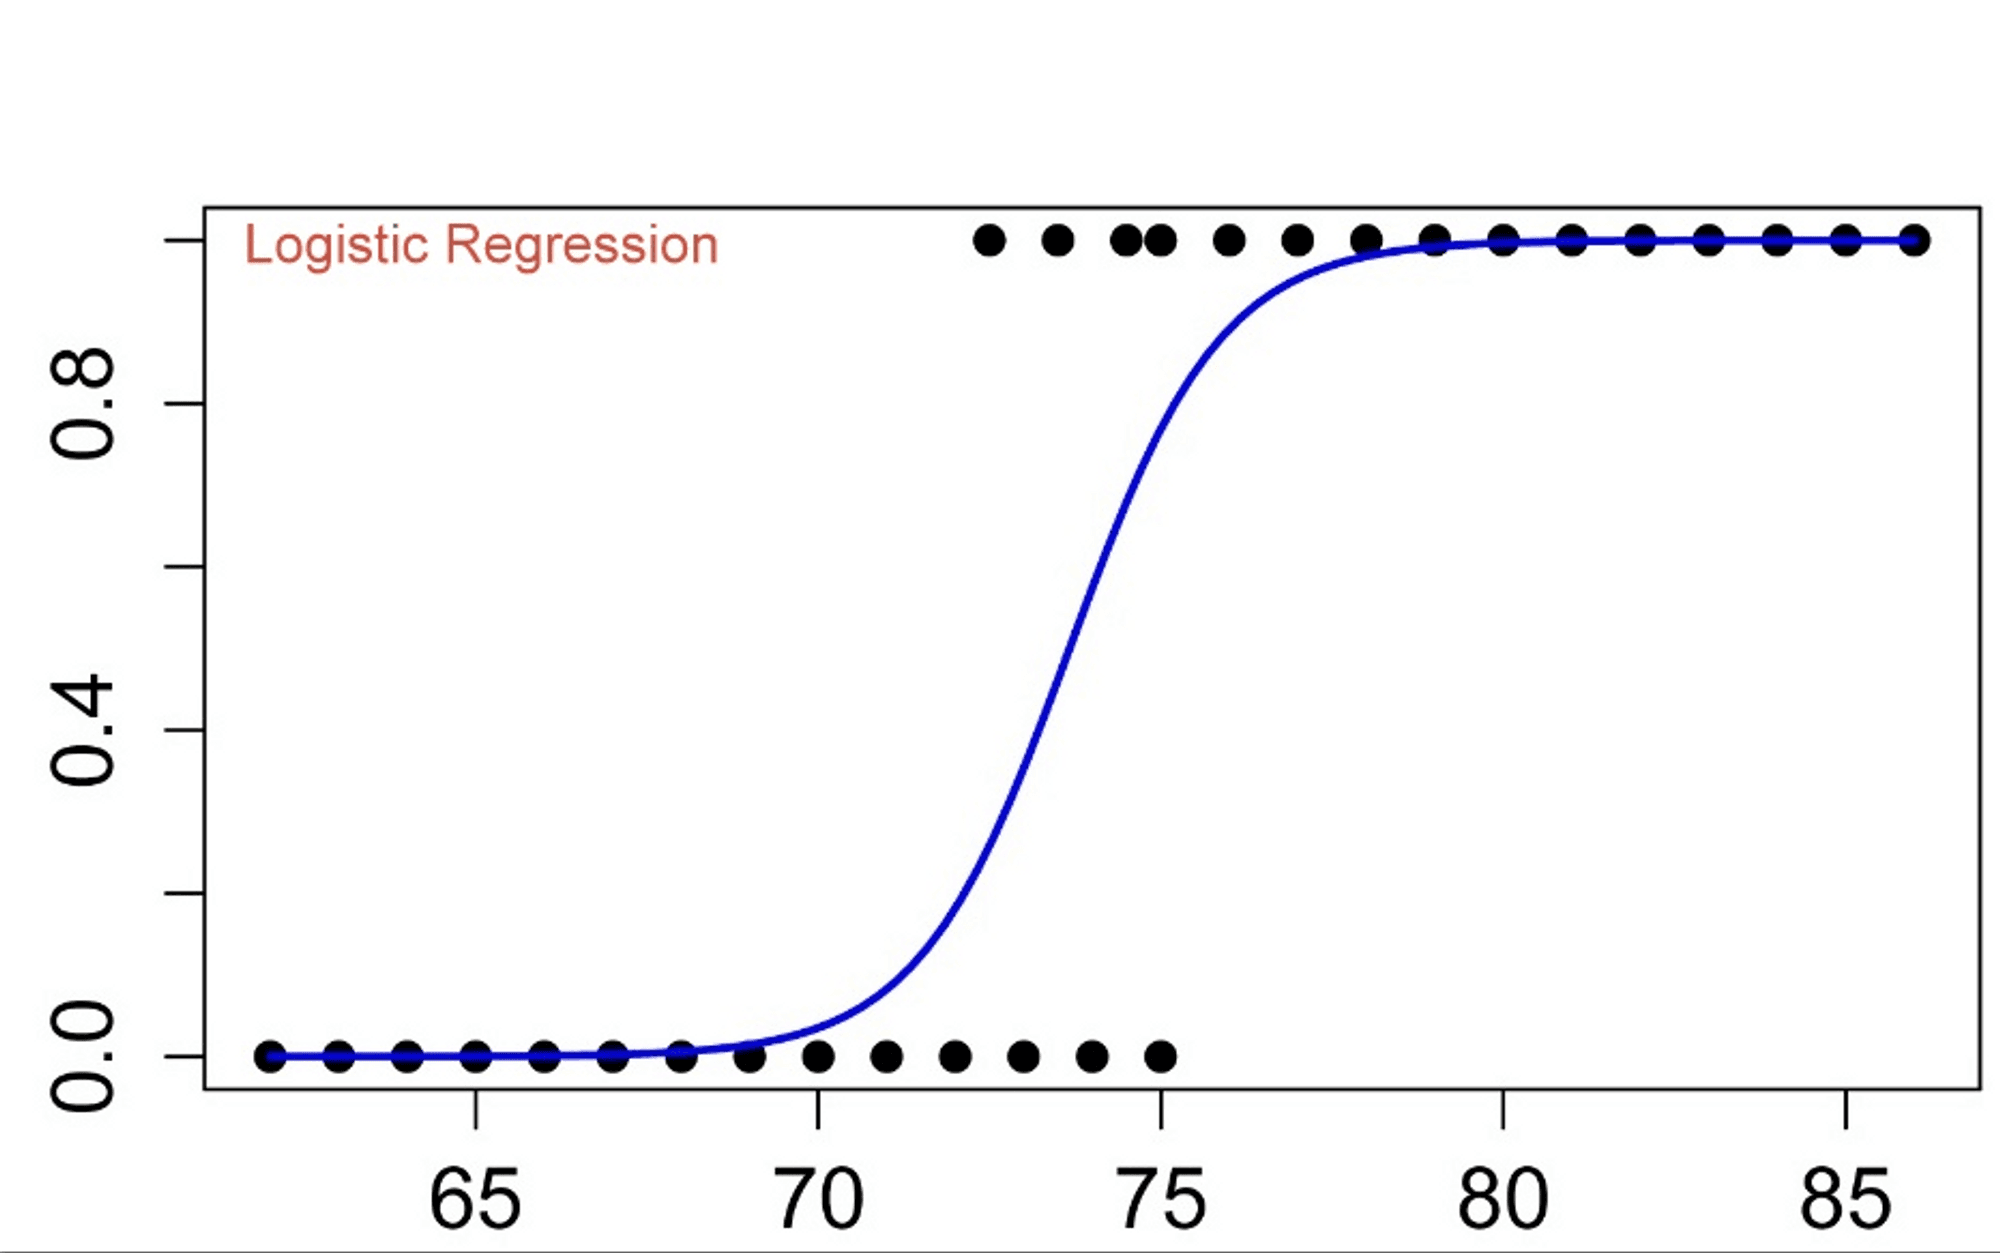
Logistic regression is a machine learning algorithm used for predicting binary outcomes. It is based on the logistic function which gives an 'S' shaped curve that can take any real-valued number and map it into a value between 0 and 1.
Model fitting in logistic regression is the process of finding the best-fit coefficients for the model. To find the best-fit coefficients, we need to minimize the cost function. The cost function for logistic regression is given by:
J(θ) = -1/m (∑i=1m [yilog(hθ(xi)) + (1 − yi) log(1 − hθ(xi))])
Where hθ(xi) is the hypothesis function given by:
hθ(xi) = 1/(1+e^(-θTx))
Once the best-fit coefficients are found, they can be used to make predictions on new data.
Coefficient interpretation in logistic regression is the process of interpreting the estimated coefficients to gain insights into how the model works. Each coefficient represents the change in the log odds of the target variable given an one-unit increase in the predictor variable, keeping all other predictors held constant. The interpretation of the coefficients can be done using odds ratios which represent the odds of a particular outcome given an one-unit increase in the predictor variable. The odds ratio for a predictor variable is given by:
Odds Ratio = e^θi
Where θi is the estimated coefficient for the predictor variable.
Real-world applications of logistic regression
Pros and Cons of Logistic regression
Logistic Regression:
Pros:
Cons:
Conclusion
After collecting information around their clients and analyzing it using logistic function, the company was able to form precise forecasts around each customer's probability of obtaining an unused item. This permitted the company to superior target its promoting endeavors and center on clients who were more likely to reply emphatically to the item. Eventually, the company was able to extend deals and maximize benefits.
Key takeaways
Quiz
1.What type of supervised learning is Logistic Regression?
Answer: a. Classification
2.What is the output of Logistic Regression?
Answer: c. A probability
3.What is the primary purpose of Logistic Regression?
Answer: a. Classification
4. What is the main difference between Logistic Regression and Linear Regression?
Answer: a. Logistic Regression is used for classification and Linear Regression is used for regression
Top Tutorials

Python
Python is a popular and versatile programming language used for a wide variety of tasks, including web development, data analysis, artificial intelligence, and more.

SQL
The SQL for Beginners Tutorial is a concise and easy-to-follow guide designed for individuals new to Structured Query Language (SQL). It covers the fundamentals of SQL, a powerful programming language used for managing relational databases. The tutorial introduces key concepts such as creating, retrieving, updating, and deleting data in a database using SQL queries.

Applied Statistics
Master the basics of statistics with our applied statistics tutorial. Learn applied statistics techniques and concepts to enhance your data analysis skills.
All Courses (6)
Master's Degree (2)
Fellowship (2)
Certifications (2)


