Your Success, Our Mission!
6000+ Careers Transformed.
Correlation and covariance are fundamental statistical concepts used to analyze the relationships between variables. They help us understand how two variables are related and whether they tend to change together. In this lesson, we'll explore these concepts, their significance, calculations, interpretation, and real-world applications.
Correlation measures the strength and direction of the linear relationship between two variables. It provides insights into how one variable changes as the other changes.

This formula quantifies the strength and direction of the linear relationship between two variables X and Y by comparing their deviations from their respective means and their joint deviations from their means.
| Month | Ice Cream Sales (X) | Average Temperature (Y) |
|---|---|---|
| Jan | 100 | 18°C |
| Feb | 150 | 20°C |
| Mar | 200 | 22°C |
| Apr | 250 | 25°C |
| May | 350 | 28°C |
| Jun | 400 | 30°C |
| Jul | 600 | 32°C |
| Aug | 750 | 32°C |
| Sep | 550 | 30°C |
| Oct | 350 | 28°C |
| Nov | 200 | 25°C |
| Dec | 150 | 20°C |
To calculate the correlation, we shall follow these steps:
1. Calculate the means (average) for both X and Y:
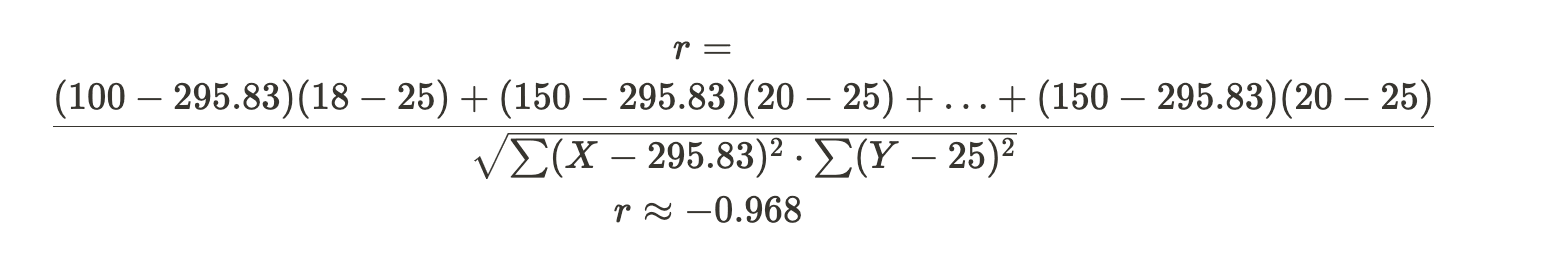
we have the Pearson’s correlation formula

Plugging in the values
2. True or False: The correlation coefficient between two variables is always between -1 and 1.
Answer
True
Covariance measures how two variables change together. It quantifies whether the variables tend to increase or decrease simultaneously.
Sample Covariance Formula:
The sample covariance is typically used when you have a sample of data points. The formula is:

Population Covariance Formula:
The population covariance is used when you have data for the entire population. The formula is:


Calculating this, we find:
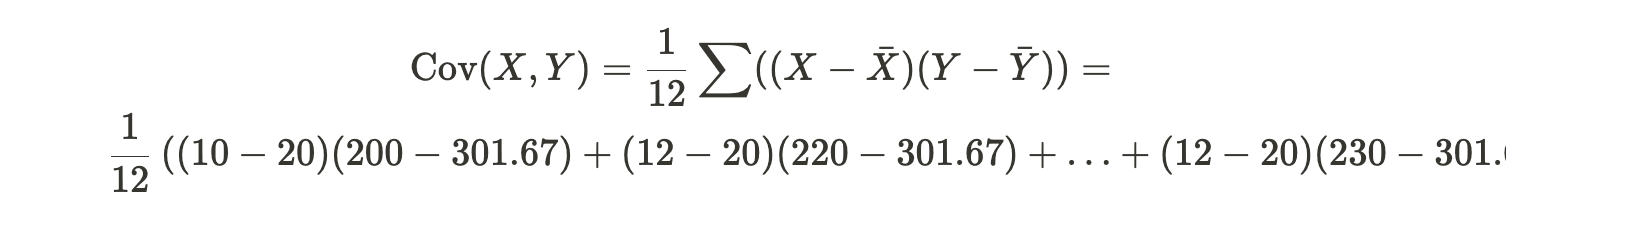
The result, approximately -1482.67, indicates a negative covariance between X and Y. This means that as X values tend to be lower than their mean, Y values tend to be higher than their mean, and vice versa. The magnitude of the covariance (1482.67) suggests a fairly strong relationship between the variables.
Answer
False
Explanation: The covariance between two variables is a measure of how much the two variables vary together. The covariance between two variables can be zero even if the two variables are not independent. For example, the covariance between two variables that are both normally distributed with a mean of 0 and a standard deviation of 1 will always be zero, even though the two variables are not independent.
Formula for Pearson's Correlation Coefficient (r):

Where:
1. The standard deviation of a variable X is 5. The standard deviation of a variable Y is 10. The covariance between X and Y is 20. What is the correlation coefficient between X and Y?
Answer
The correlation coefficient between X and Y is equal to the covariance between X and Y divided by the product of the standard deviations of X and Y. In this case, the covariance between X and Y is 20 and the standard deviations of X and Y are 5 and 10, respectively. Therefore, the correlation coefficient between X and Y is equal to 20 / (5 * 10) = 0.4
2. The covariance between two variables X and Y is 2. What is the correlation coefficient between X and Y?
Answer
The correlation coefficient between X and Y cannot be determined.
Explanation: The covariance between two variables is a measure of how much the two variables vary together. The correlation coefficient between two variables is a measure of the strength of the linear relationship between the two variables. The covariance between X and Y can be any value, positive or negative. The correlation coefficient between X and Y can only be positive or negative, and it cannot be greater than 1 or less than -1. Therefore, the correlation coefficient between X and Y cannot be determined from the information given.
1. Finance:
2. Economics:
3. Medicine:
4. Quality Control:
5. Environmental Science:
Correlation and covariance are fundamental concepts in statistics and data analysis. Correlation allows us to assess the strength and direction of linear relationships between two variables, providing insights into how they move together. On the other hand, covariance quantifies how two variables change in relation to each other, indicating whether they tend to increase or decrease together. Both correlation and covariance play crucial roles in understanding and modeling data, making informed decisions, and identifying patterns and trends in various fields, from finance and economics to science and engineering.
Correlation and covariance are essential concepts for anyone dealing with data analysis and decision-making, enabling a deeper understanding of the relationships between variables and their real-world applications.
1. If σx = σy and x, y are related by u = x + y; v = x − y, what is the cov(u,v)?
Answer
The covariance between u and v is equal to zero.
cov(u, v) = E[(u - u')(v - v')] = E[(x + y - u')(x - y - v')] where u' and v' are the means of u and v respectively.
Expanding the terms, we get
cov(u, v) = E[x^2 - 2xy + y^2 - u'^2 + u'v' - v'^2] Since x and y are related by u = x + y and v = x - y, we can see that the terms x^2 - 2xy + y^2 and u'^2 - v'^2 cancel each other out.
Therefore, the covariance between u and v is equal to
cov(u, v) = E[u'v'] = 0 This is because the expected value of the product of two independent random variables is zero. In this case, u' and v' are independent because they are the means of u and v respectively.
2. What is the correlation between x and a−x?
Answer
The correlation coefficient between two variables is a measure of how strongly they are related. It is calculated by taking the covariance of the two variables and dividing it by the product of their standard deviations.
In this case, the covariance of x and a-x is zero. This is because the expected value of the product of x and a-x is zero. The standard deviations of x and a-x are also equal, since they are both equal to the absolute value of a.
Therefore, the correlation coefficient between x and a-x is equal to -1 This means that x and a-x are perfectly negatively correlated. In other words, as x increases, a-x decreases, and vice versa.
3. The variance of return on investment A is 0.68, while the variance of return on investment B is 0.55. If the correlation coefficient between the returns on A and B is -.50, the covariance of returns on A and B is:
Answer
To calculate the covariance between two assets (A and B), you can use the following formula:
Cov(A, B) = Corr(A, B) * σ(A) * σ(B)
Where:
4. If the correlation coefficient between x and y is 0.6, the covariance is 27, and the variance of y is 25, what is the variance of x?
Answer
Given:
Top Tutorials

Python
Python is a popular and versatile programming language used for a wide variety of tasks, including web development, data analysis, artificial intelligence, and more.

SQL
The SQL for Beginners Tutorial is a concise and easy-to-follow guide designed for individuals new to Structured Query Language (SQL). It covers the fundamentals of SQL, a powerful programming language used for managing relational databases. The tutorial introduces key concepts such as creating, retrieving, updating, and deleting data in a database using SQL queries.

Data Science
Learn Data Science for free with our data science tutorial. Explore essential skills, tools, and techniques to master Data Science and kickstart your career
All Courses (6)
Master's Degree (2)
Fellowship (2)
Certifications (2)


