Your Success, Our Mission!
6000+ Careers Transformed.
You walk into your favorite shopping mall .
Some shoppers rush straight to the electronics store, some head to the makeup section, while others check out the food court .
Now imagine you’re the mall manager you want to understand what each group likes so you can:
But how do you do that when you have thousands of customers? That’s where Machine Learning swoops in like a genius detective!
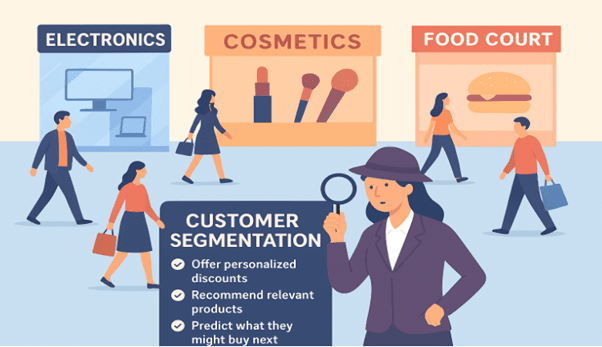
Customer segmentation is the process of dividing customers into groups based on common characteristics like age, income, spending habits, or interests.
Instead of treating all customers the same, you train an ML model to find patterns that group them automatically.
Think of it like Spotify creating playlists not manually, but by understanding your vibe!
Let’s explore how ML creates these customer groups
We start with a dataset containing information like:
| Customer ID | Age | Annual Income (₹) | Spending Score (1–100) |
|---|---|---|---|
| 1 | 24 | 30,000 | 65 |
| 2 | 45 | 85,000 | 40 |
| 3 | 30 | 55,000 | 80 |
This data gives us a clue about how customers behave financially.
Before analysis, we ensure there are no missing values, fix any outliers, and scale the data to balance differences between income and spending score.
Here, we choose the features that best represent customer behavior, usually Income and Spending Score.
These become the “axes” on which we’ll group our customers visually.
We use Unsupervised Learning, specifically the K-Means Clustering Algorithm.
It automatically groups customers into clusters like “Luxury Shoppers,” “Budget Buyers,” and “Casual Visitors.”
For example:
| Cluster | Description |
|---|---|
| Cluster 1 | High income, high spending — Premium Shoppers |
| Cluster 2 | Low income, high spending — Impulse Buyers |
| Cluster 3 | High income, low spending — Cautious Spenders |
Using a scatter plot, you can see distinct groups of customers. Each color represents a unique behavior pattern. Your ML model just decoded human shopping behavior!
Here’s how you can build this project step by step:
# Step 1: Import Libraries
import pandas as pd
import matplotlib.pyplot as plt
from sklearn.cluster import KMeans
from sklearn.preprocessing import StandardScaler

# Step 2: Load Data
data = pd.read_csv("Mall_Customers.csv")
X = data[['Annual Income (k$)', 'Spending Score (1-100)']]

# Step 3: Preprocess Data
scaler = StandardScaler()
X_scaled = scaler.fit_transform(X)

# Step 4: Apply K-Means
kmeans = KMeans(n_clusters=5, random_state=42)
data['Cluster'] = kmeans.fit_predict(X_scaled)

# Step 5: Visualize
plt.scatter(X['Annual Income (k$)'], X['Spending Score (1-100)'],
            c=data['Cluster'], cmap='rainbow')
plt.xlabel('Annual Income (k$)')
plt.ylabel('Spending Score (1-100)')
plt.title('Customer Segmentation using K-Means')
plt.show()
Try different numbers of clusters (n_clusters) and visualize how customer groups change. You can also add Age or Gender as extra features for more precise segmentation.
Top Tutorials

Data Science
Learn Data Science for free with our data science tutorial. Explore essential skills, tools, and techniques to master Data Science and kickstart your career

MLOps
Dive into the fundamentals with our MLOPs tutorial. Learn MLOps best practices and streamline your ML operations for enhanced productivity and reliability.

ChatGPT
In this ChatGPT tutorial, learn how to use ChatGPT effectively. Master the art of conversational AI with our step-by-step lessons. Start to learn ChatGPT today!
All Courses (6)
Master's Degree (2)
Fellowship (2)
Certifications (2)


