


Without a strong foundation in mathematics, it would be difficult to develop reliable models and algorithms for data analysis. Furthermore, mathematical methods are often used to verify the results of data science experiments.
Thus, mathematics is essential for data science in order to develop sound models and methods for analyzing data.
In this blog from AlmaBetter’s team we are going to learn about Random Variables for Data Science. Read on!.
What are Random Variables?
Random variables are mathematical constructs that allow us to model uncertainty. They are essential for performing statistical analysis and making probabilistic predictions.
Random variables can be discrete or continuous. A discrete random variable is one that can take on a finite or countable number of values, such as the roll of a dice. A continuous random variable is one that can take on an infinite number of values, such as the height of a person.
Random variables have a well-defined probability distribution. The distribution of a random variable tells us what values the variable is most likely to take on, and how likely it is for the variable to take on any given value.
We can use random variables to model real-world phenomena that are inherently uncertain.
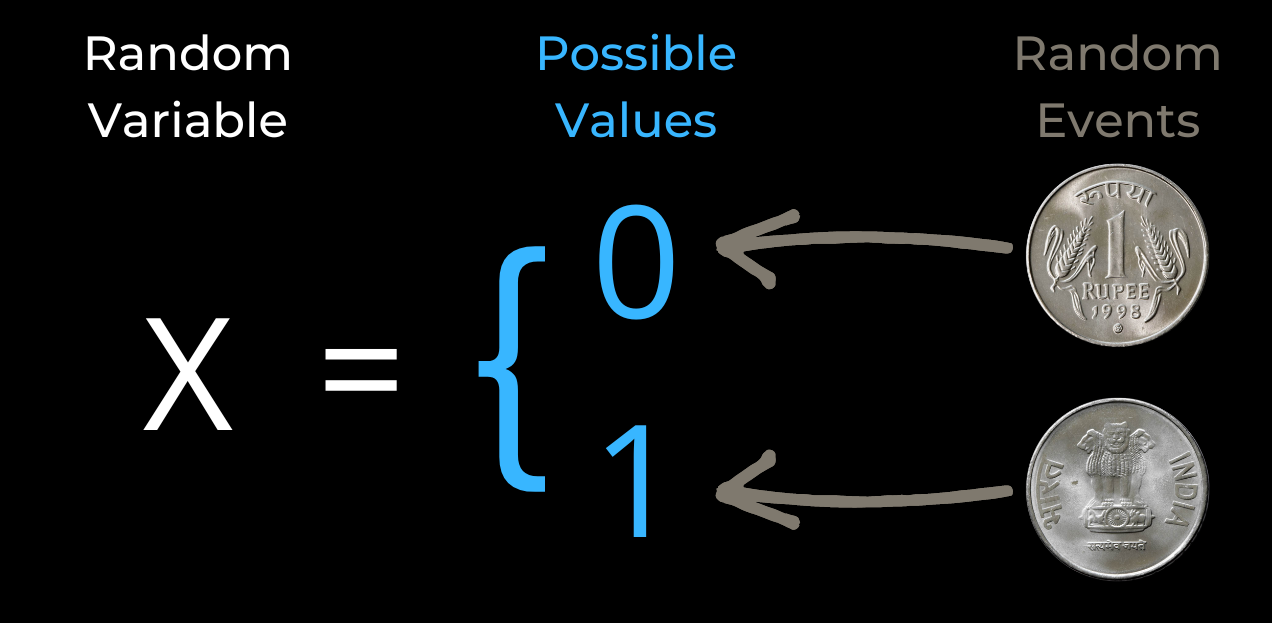
For example, we may use a random variable to model the outcome of a coin flip, or the number of people who will show up to a concert.
Random variables are a powerful tool for modeling uncertainty, and they allow us to make probabilistic predictions about the world around us.
Types of Random Variables
There are three types of random variables.
- Discrete random variable: A variable that is not continuous, meaning that it has a finite number of possible values. For example, the random variable x can take on the values 0, 1, 2, or 3.
Real-life example: The number of cars sold by a car dealer in one month.

- Continuous random variable: A variable that is continuous, meaning that it can take on any value within a certain range. For example, the random variable y can take on any value between 0 and 1.
Real-life example: The length of time it takes for a truck driver to go from New Delhi to Mumbai.

- Mixed random variable: A variable that is both discrete and continuous. For example, the random variable z can take on any value between 0 and 1, but can also take on the values 0, 1, 2, or 3.
Real-life example: Stock options is the best example of mixed random variable.

Probability Distribution of Random Variables
The probability distribution of a random variable is a function that describes how likely it is for the random variable to take on each of its possible values. The distribution is often represented using a graph, with the possible values of the random variable on the x-axis and the probabilities on the y-axis.
There are many different types of probability distributions, but the most common ones are the uniform distribution, the normal distribution, and the Poisson distribution.
The Uniform distribution is a distribution in which all values of the random variable are equally likely. This is often represented by a graph that is flat, like a coin.
The Normal distribution is a distribution in which values near the mean are more likely than values far from the mean. This is often represented by a bell-shaped curve.
The Poisson distribution is a distribution in which values that are close together in time are more likely than values that are far apart in time. This is often represented by a graph that has a peak in the middle and tails that get gradually smaller as they go further from the peak.
Uses of Random Variables in Data Science
There are many uses of random variables in data science. Some common examples are:
Modeling data: Many data sets can be modeled using random variables. For example, a data set can be modeled as a collection of Bernoulli random variables (each representing a success/failure outcome), or as a Normal distribution (representing continuous data).
Generating synthetic data: Random variables can be used to generate synthetic data sets. This can be useful for testing algorithms or for creating training data sets.
Sampling: Random variables can be used to sample from data sets. This can be used for instance to select a random subset of a data set, or to compute estimators.
Optimization: Random variables can be used in optimization algorithms. For example, stochastic gradient descent is a popular optimization algorithm that uses random variables.
Conclusion:
Random variables are a key concept in data science, and understanding them is essential to becoming a Data Scientist. They can be used to represent any data, and to model any process. By understanding random variables, Data Scientists can build models that are more accurate and more powerful.
Start your career in Data Science with AlmaBetter’s Full Stack Data Science program and land a job that pays a minimum of 6 LPA.
To read our latest blog on “Top 4 Books that every programmer should have in their library”, click here.


