


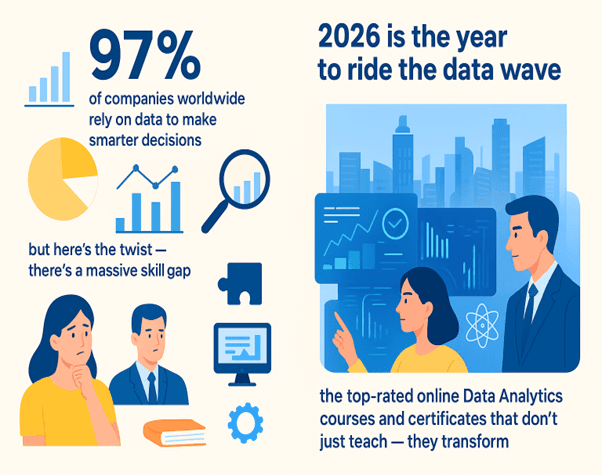
In the next five years, 97% of companies worldwide will rely on data to make smarter decisions.
But here’s the twist: there's a massive skill gap between the demand for data analysts and the people who can actually do the job.
That’s your golden ticket.
Whether you’re a student, a professional, or someone ready for a career switch, 2026 is the year to ride the data wave.
In this article, we’ll uncover the top-rated online Data Analytics courses and certificates that don’t just teach they transform.
Because in the era of AI and automation, those who understand data will lead the future.
Why Learn Data Analytics in 2026
In 2026, data is not just information, it's the foundation of every major decision in business, healthcare, education, and even entertainment. From predicting customer trends to detecting diseases early, Data Analytics transforms raw numbers into real-world impact.
But here’s the big picture:
- 97% of global companies will depend on data for decisions.
- Yet, there’s a severe shortage of skilled analysts to fill millions of open positions.
This gap is your career opportunity.
Learning data analytics today means you’re not just preparing for a job
you’re future-proofing your career in an economy that runs on insights, not instincts.
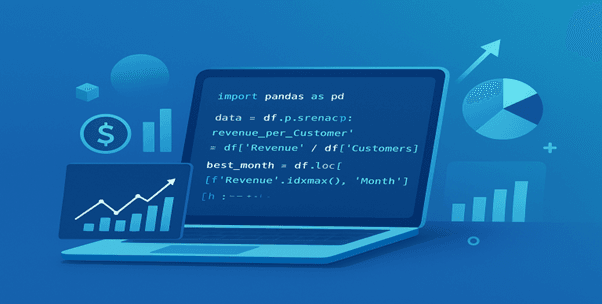
Code Example: “Uncovering Hidden Insights from Data”
Here’s a more realistic and insightful Python example that actually analyzes and visualizes real-like business data perfect for showcasing how data analytics turns numbers into decisions.
import pandas as pd
import matplotlib.pyplot as plt

# Sample data: monthly sales trends
data = {
    'Month': ['Jan', 'Feb', 'Mar', 'Apr', 'May', 'Jun'],
    'Revenue': [85000, 92000, 88000, 97000, 112000, 125000],
    'Customers': [420, 460, 450, 490, 530, 600]
}

df = pd.DataFrame(data)

# Calculate revenue per customer
df['Revenue_per_Customer'] = df['Revenue'] / df['Customers']

# Identify the best-performing month
best_month = df.loc[df['Revenue'].idxmax(), 'Month']

print(f" Best Sales Month: {best_month}")
print(df)

# Visualize the revenue trend
plt.figure(figsize=(8,4))
plt.plot(df['Month'], df['Revenue'], marker='o', linewidth=3)
plt.title('Monthly Revenue Growth in 2026')
plt.xlabel('Month')
plt.ylabel('Revenue ($)')
plt.grid(True)
plt.show()
Output
Best Sales Month: June
| Month | Revenue | Customers | Revenue_per_Customer |
|---|---|---|---|
| Jan | 85,000 | 420 | 202.38 |
| Feb | 92,000 | 460 | 200.00 |
| Mar | 88,000 | 450 | 195.55 |
| Apr | 97,000 | 490 | 197.95 |
| May | 112,000 | 530 | 211.32 |
| Jun | 125,000 | 600 | 208.33 |
Insight: Sales are rising steadily each month, June being the top performer. This tells a business to plan larger campaigns or new product launches mid-year when engagement peaks.
Technical Example
Let’s say a company wants to predict which customers are likely to cancel subscriptions.
By applying predictive analytics models using Python or Power BI, they can identify risk factors like:
- Low engagement rate
- Payment delays
- Short session times
This allows the business to take action, send reminders, offer discounts, or improve user experience before losing customers.
Real-Life Example
- Netflix: Uses analytics to recommend shows tailored to your taste boosting engagement.
- Amazon: Predicts customer purchases before they happen, optimizing inventory and logistics.
- Healthcare: Predictive analytics helps detect early signs of diseases like diabetes or heart conditions.
- Finance: Banks use data analytics to flag suspicious transactions and prevent fraud.
Top Data Analytics Courses & Certificates [2026 Edition]
The year 2026 marks a turning point. Companies are not just hiring data analysts, they’re hiring strategic thinkers who can turn raw data into powerful business actions.
That’s why enrolling in the right data analytics course can completely redefine your career path.
These courses don’t just teach tools like Python, SQL, Power BI, and Excel they train your brain to think analytically, preparing you for high-demand roles across industries like finance, healthcare, marketing, and AI-driven technology.
Let’s explore the top courses and certificates leading the revolution
1. AlmaBetter Full Stack Data Analytics Program
Overview:
A complete industry-aligned program designed for learners who want to go from beginner to job-ready analyst with guaranteed placement.
What You’ll Learn:
- Data cleaning, visualization, and storytelling
- Python, SQL, Excel, and Power BI
- Real-world projects and case studies
- Resume & interview preparation
Why It Stands Out (2026 Perspective):
- Job guarantee with top companies
- Lifetime access to content
- Mentorship from industry experts
AlmaBetter Link:https://www.almabetter.com/learn/full-stack-data-analytics-course
Technical Example:
During the course, learners often build projects like:
- Sales Forecast Dashboard: Predicting monthly revenue trends using Power BI.
- Customer Churn Analysis: Using Python to identify customers likely to leave a service.
Real-Life Application:
Alumni have applied these skills in roles like Business Analyst, Data Scientist, and Analytics Consultant, working with large datasets in marketing and fintech domains.

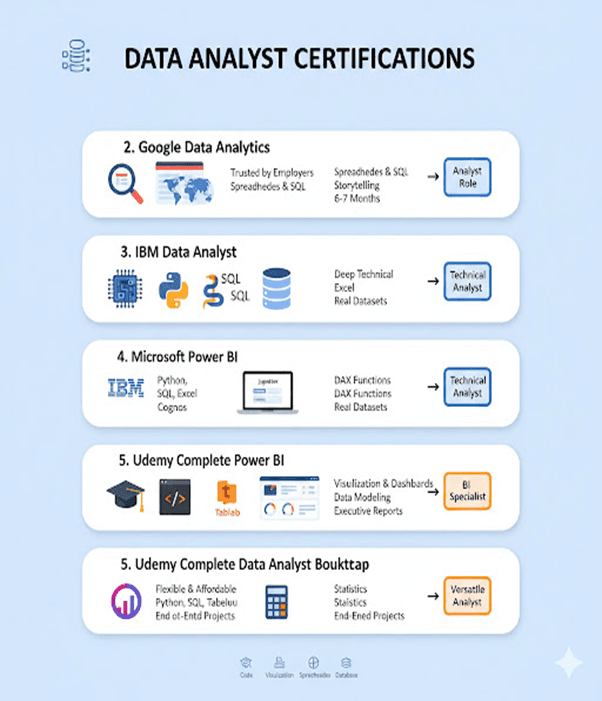
2. Google Data Analytics Professional Certificate (Coursera)
Overview:
One of the most popular entry-level certifications trusted by employers globally.
What You’ll Learn:
- Data cleaning & visualization in spreadsheets and SQL
- Foundations of data-driven storytelling
- Analytical thinking for business decision-making
Duration: 6–7 months (self-paced)
Real-Life Use Case:
Many learners start as beginners and transition into analyst roles at companies like Accenture or Deloitte after completing this program.
3. IBM Data Analyst Professional Certificate (Coursera)
Overview:
This course bridges theory and real-world data practice — ideal for those looking for a deeper technical foundation.
Tools Covered:
Python, SQL, Excel, Cognos, and Jupyter Notebooks.
Project Example:
- Analyzing real datasets from industries like retail or healthcare to derive actionable insights.
Real-Life Use Case:
Graduates often use this certification to transition from non-technical to technical analyst roles.
4. Microsoft Power BI Data Analyst Course
Overview:
Focused entirely on data visualization and dashboard design, this course is perfect for professionals already working with business data.
Key Skills:
- Building interactive dashboards
- DAX functions and data modeling
- Data storytelling for executives
Example:
Creating a Dynamic Sales Dashboard that updates KPIs in real time for business meetings.
5. Udemy Complete Data Analyst Bootcamp
Overview:
A flexible and affordable choice for self-paced learners.
What You’ll Learn:
- Python, SQL, Tableau, and Statistics
- End-to-end projects for beginners
You got it! Here's a visual conceptual diagram as an image, summarizing the different data analyst certifications and their focus.
Comparison Snapshot
| Platform | Duration | Skill Level | Highlights | Placement Support |
|---|---|---|---|---|
| AlmaBetter | 6–8 months | Beginner–Advanced | Full Stack + Job Guarantee | ✅ Yes |
| Google (Coursera) | 6 months | Beginner | Foundational + Recognized | ❌ No |
| IBM (Coursera) | 8 months | Intermediate | Technical + Real Projects | ❌ No |
| Microsoft Power BI | 3 months | Intermediate | Visualization Focus | ❌ No |
| Udemy | Flexible | Beginner | Budget-Friendly | ❌ No |
Key Skills You’ll Learn
In today’s data-first world, it’s not just about collecting data it’s about understanding what it says.
The best data analytics courses don’t just teach tools they teach how to think like an analyst.
Here’s a breakdown of the core skills that will make you stand out in 2026
Data Cleaning & Preprocessing
Before insights come clarity.
You’ll learn how to clean messy datasets, handle missing values, and prepare data for analysis using Python, SQL, or Excel.
Here's another conceptual diagram for Data Cleaning & Preprocessing, this time focusing on the transformation aspect.
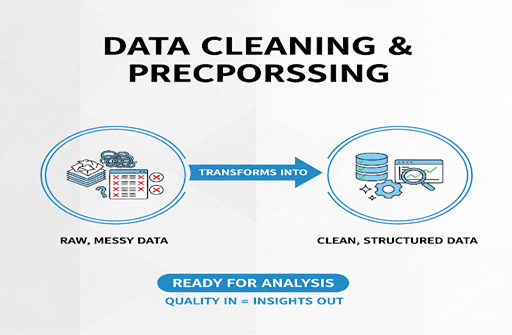
Why it matters: Clean data = trustworthy decisions.
Data Visualization & Storytelling
Numbers tell stories and visualization is how you make them speak.
Courses teach Tableau, Power BI, and Matplotlib to help you create clear, impactful dashboards.
Here's a simple conceptual diagram for Data Visualization & Storytelling, presented as an image.
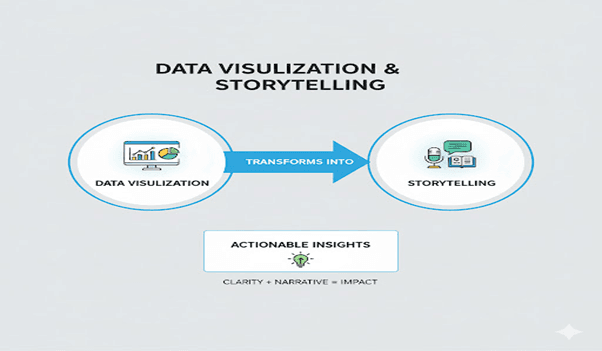
Why it matters: A single dashboard can change how leaders see their business.
Statistical & Analytical Thinking
From hypothesis testing to regression analysis, you’ll learn how to find patterns, relationships, and meaning in data.
Here's a conceptual diagram for Statistical & Analytical Thinking, presented as an image.
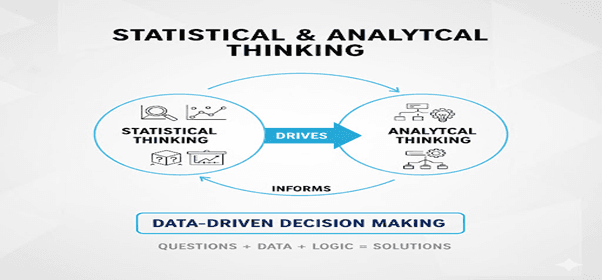
Why it matters: These skills turn raw data into insights that drive real-world results.
SQL, Python & Excel Mastery
Whether it’s querying data with SQL, analyzing it in Python, or presenting it in Excel these are your bread and butter tools.
Here's a conceptual diagram illustrating the mastery of SQL, Python, and Excel, and how they collectively empower data analysis.
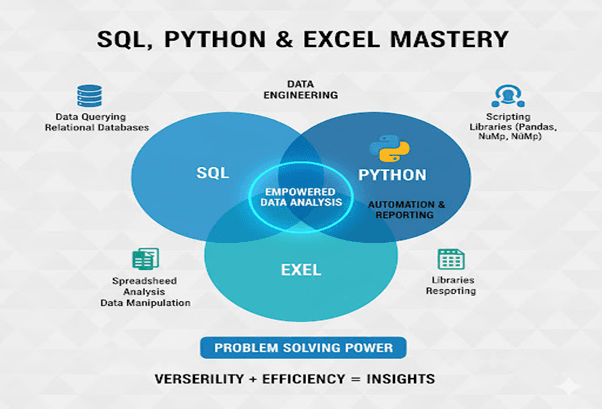
Why it matters: Every data role demands fluency in at least one top analyst who knows all three.
Machine Learning & Predictive Modeling (Advanced)
Some courses go beyond analytics into AI and ML training models that predict trends, customer behavior, or risks.
Here's a conceptual diagram for Machine Learning & Predictive Modeling (Advanced), illustrating the flow from data to future predictions.
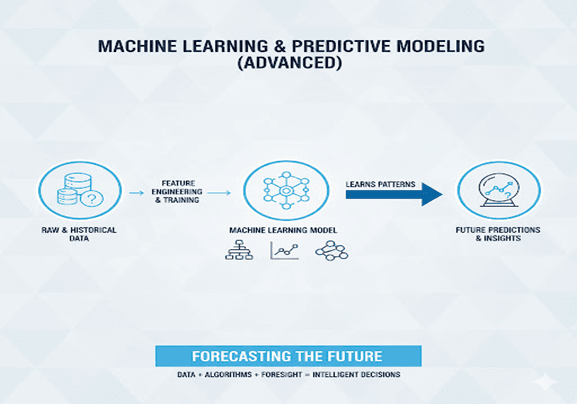
Why it matters: Predictive analytics is the future of business decision-making.
Business & Domain Understanding
Technical skills are powerful but knowing how to apply them in business contexts is what gets you hired.
Here's a conceptual image representing Business & Domain Understanding:
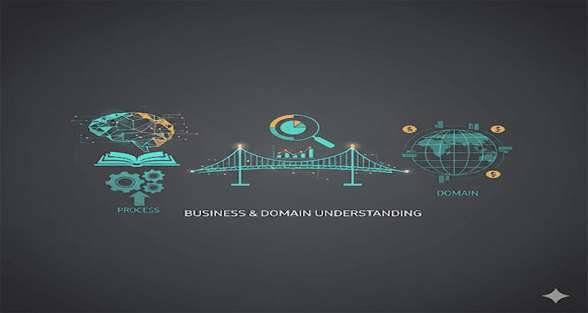
Why it matters: Employers value analysts who understand both data and business impact.
Communication & Data-Driven Decision Making
You’ll learn how to present findings clearly through visualizations, reports, and strategic recommendations.
Here's a simple conceptual image representing Communication & Data-Driven Decision Making:
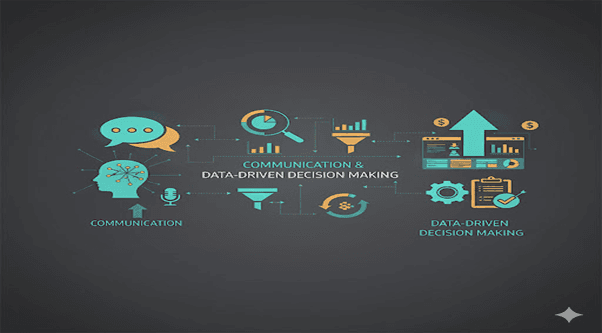
Why it matters: Great analysts don’t just find insights they influence decisions.
| Skill Area | Tools / Techniques | Career Impact |
|---|---|---|
| Data Cleaning | Python, SQL, Excel | Build accurate, reliable data pipelines |
| Visualization | Tableau, Power BI, Matplotlib | Communicate insights effectively |
| Statistics | Probability, Regression | Build analytical mindset |
| Programming | Python, R | Automate and scale analysis |
| Machine Learning | Scikit-learn, TensorFlow | Predict future outcomes |
| Business Acumen | Case Studies | Apply insights to real-world problems |
Real-Life Use Cases of Data Analytics
Ever wondered how Netflix knows exactly what you’ll binge next?
Or how hospitals predict patient emergencies before they happen?
That’s not magic, it's data analytics in action.
Let’s explore some real, mind-blowing examples of how companies and industries are using data to transform the world in 2026
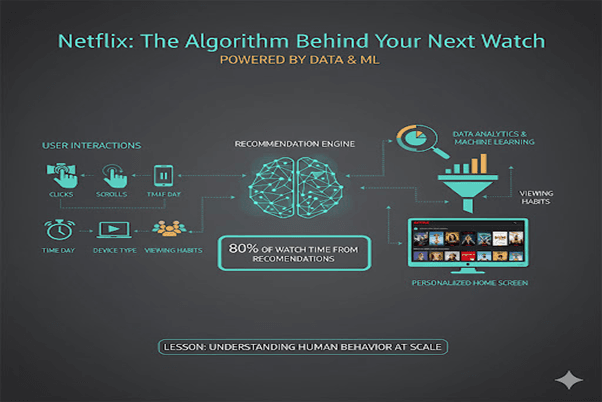
Netflix: The Algorithm Behind Your Next Watch
Every click, scroll, and pause on Netflix feeds into a massive recommendation engine powered by data analytics and machine learning.
- Netflix analyzes viewing habits, time of day, and device type to personalize your home screen.
- The result? Over 80% of what users watch comes from recommendations.
Lesson: Data analytics isn’t just about numbers, it's about understanding human behavior at scale.
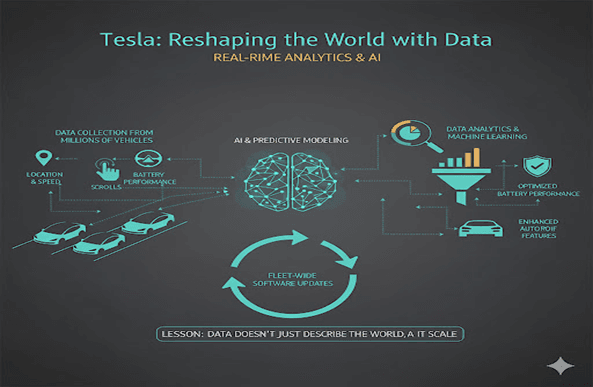
Tesla: The Car That Learns From Every Drive
Tesla vehicles constantly collect and analyze data from millions of cars on the road.
- Using real-time analytics and predictive modeling, Tesla improves safety, battery performance, and autopilot features.
- Each mile driven helps Tesla engineers fine-tune the entire fleet.
Lesson: Data doesn’t just describe the world, it reshapes it.
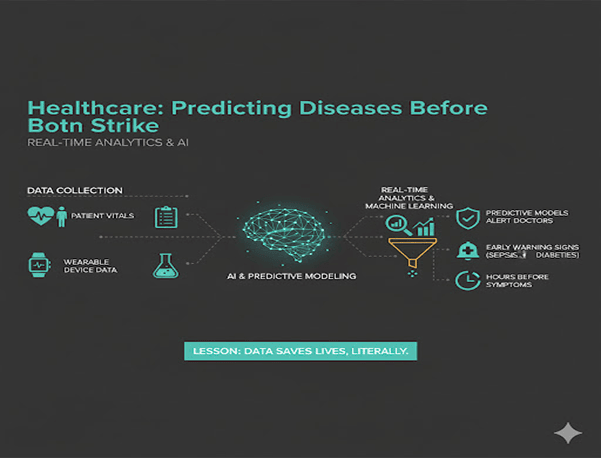
Healthcare: Predicting Diseases Before They Strike
Hospitals now use analytics to detect early warning signs of diseases like sepsis and diabetes.
- Patient vitals, lab reports, and even wearable device data are analyzed in real time.
- Predictive models alert doctors hours before a patient shows visible symptoms.
Lesson: Data saves lives literally.
Here's a conceptual image representing "Healthcare: Predicting Diseases Before They Strike":
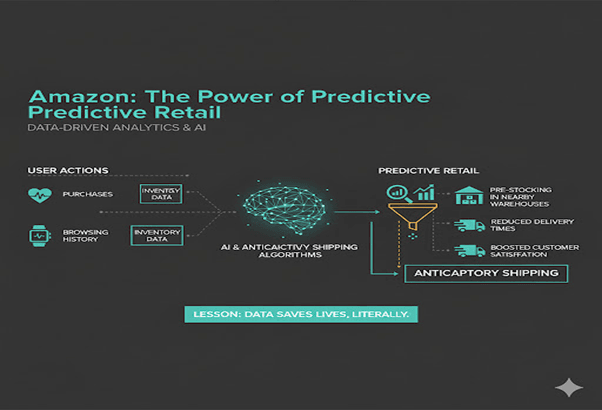
Amazon: The Power of Predictive Retail
Amazon’s secret sauce is its data-driven logistics.
- Every time you buy something, Amazon’s algorithms predict what you’ll buy next and pre-stocks it in nearby warehouses.
- This is called anticipatory shipping, reducing delivery times and boosting customer satisfaction.
Lesson: The smarter the data, the faster the business moves.
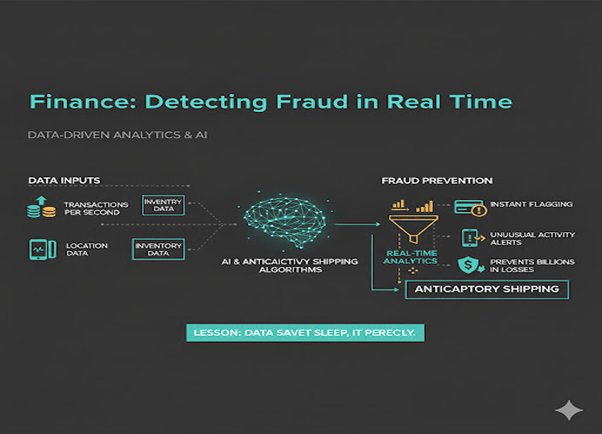
Finance: Detecting Fraud in Real Time
Banks and fintech apps analyze millions of transactions per second using AI-driven anomaly detection.
- If your card is used unusually, say, in another country the system flags it instantly.
- These analytics systems prevent billions in fraud losses every year.
Lesson: Data doesn’t sleep, it protects.
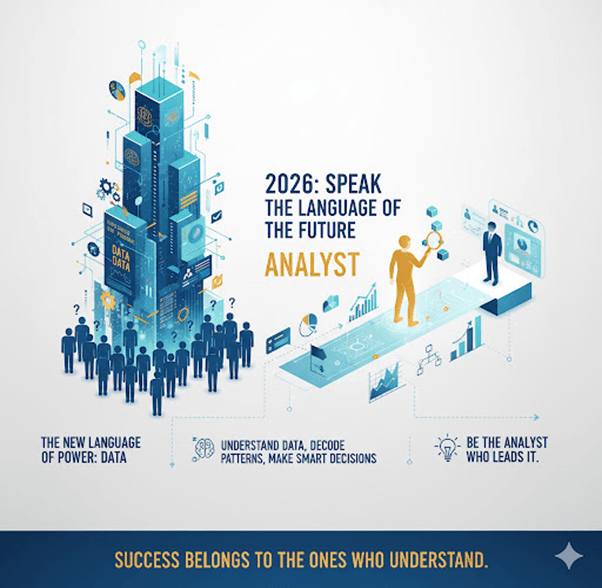
Conclusion:
In the age of AI, automation, and endless information data has become the new language of power.
But here’s the truth: not everyone can read it.
That’s where you come in.
Whether you’re a student curious about analytics, a professional ready for a career switch, or someone chasing growth 2026 is your chance to speak the language of the future.
Because in the next decade, success won’t just belong to the ones who work hard
it will belong to the ones who understand data, decode patterns, and make smart decisions.
Every chart you build, every dataset you analyze, every insight you uncover brings you one step closer to becoming the mind behind the numbers.
So, don’t just watch the data revolution.
Be the analyst who leads it.
Here's a conceptual image on a light background, representing the importance of data literacy in the age of AI and automation:
Additional Readings:
Want to go beyond the basics and truly shine in Data Science and Analytics? These curated AlmaBetter resources are your secret weapons! From mastering statistics to leveling up your skills for top careers, each article is packed with insights, tips, and practical knowledge to help you stay ahead in the fast-paced world of data. Dive in, explore, and supercharge your learning journey!
Data Science Course Syllabus: Your Roadmap to Mastery
Explore AlmaBetter's comprehensive Data Science syllabus, covering everything from mathematical foundations to machine learning and data visualization. This curriculum is designed to equip you with the essential skills needed to excel in the dynamic field of Data Science.
Link: https://www.almabetter.com/bytes/articles/data-science-course-syllabus?utm_source=chatgpt.com
Is Data Science a Good Career for 2025?
Considering a career in Data Science? This article delves into job security, high wages, and growth prospects in the field, helping you make an informed decision about your future.
Link: https://www.almabetter.com/bytes/articles/is-data-science-a-good-career?utm_source=chatgpt.com
Data Manipulation: The Guide to Data Handling Techniques
Master the art of transforming raw data into valuable insights. This article covers essential data manipulation techniques, including cleaning, validating, and transforming data for analysis.
Link: https://www.almabetter.com/bytes/articles/data-manipulation?utm_source=chatgpt.com


