


Data Scientists should make an effort to learn statistics because statistics relate data to the questions organizations face across all disciplines, such as how to increase revenue, limit spending, create efficiencies, and maximize communications, etc.
In general, it is important for Data Scientists to have a strong foundation in statistical concepts and techniques and to be able to apply these concepts and techniques to real-world problems. This will enable them to analyze and interpret data effectively, and to communicate their findings to others in a clear and concise manner.

What is statistics?
Statistics is a way of using mathematics to make sense of data and to draw conclusions from it. It is used in a myriad of fields, including science, business, and government, to help make informed decisions based on evidence and data rather than just intuition or personal opinion.
Some common statistical techniques include collecting and organizing data into tables and graphs, calculating measures of central tendency (such as the mean or median), and implementing statistical tests to determine the likelihood that a particular result occurred by chance.
How is statistics used in Data Science and Data Analytics?
Statistics plays a crucial role in Data Science and Data Analytics, as it provides the tools and techniques needed to analyze and understand data. Most of the Data scientists spend more time in data pre-processing and at every step statistics plays a vital role.
Some of the ways in which statistics is used in these fields include:
Exploratory Data Analysis: Statistics is used to explore and summarize the data, including visualizing it through graphs and plots, and calculating summary statistics such as the mean and standard deviation.
Modeling and prediction: Statistical techniques, such as regression and classification, are used to build machine learning models that can analyze and make predictions based on data.
Hypothesis testing: Statistical tests are used to determine whether a particular result is statistically significant, or whether it is likely to have occurred by chance. For example, In our judicial system, a person is innocent until proven guilty. If we cannot prove a hypothesis wrong, it is accepted until it is proven incorrect.
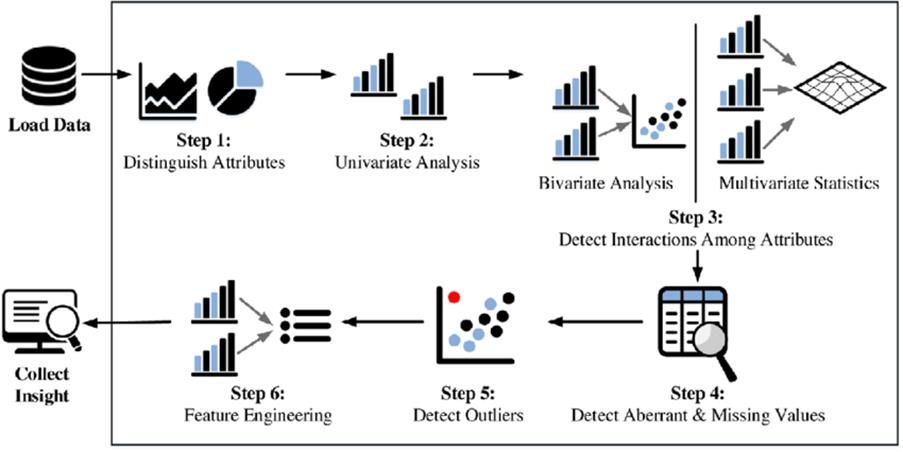
In the life cycle of a Data Science project, statics is widely used in data preprocessing:
To identify the significance of features in the data by using various statistical tests. To eliminate redundant features by finding the relationship between them. To convert the features into the required format. To scale and identify the distribution of data and the nature of data. After processing the data, using the right statistical approach/model. Verifying the results obtained on the different accuracy measurement scales. Processing the data, from beginning to the end of the complete cycle, is a requirement for statistics at every single step. That’s why proficient statistical knowledge is a boon for a good Data Scientist. The use of statistics in Data Science and Data Analytics helps provide a better understanding of the data and draw meaningful insights and conclusions from it.
How are Statistics and Data Science related?
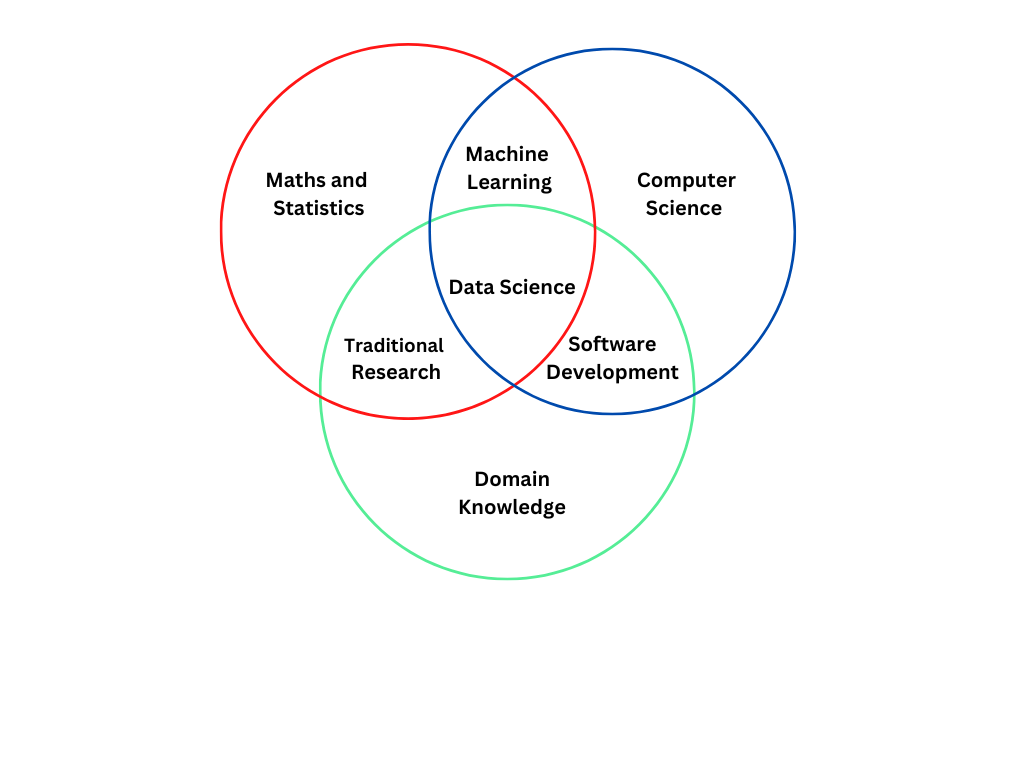
Statistics and Data Science are closely related fields, both of which involve the analysis of data to draw insights and make decisions. Both fields use tools and techniques from mathematics and computer science to analyze and understand data. Data Science is an umbrella that encompasses a wide range of techniques for collecting, storing, and analyzing data, including statistical methods. Data Scientists often use statistical techniques to explore and summarize data, build predictive models, and test hypotheses.
Statistics, on the other hand, is a more specialized field that focuses specifically on the collection, analysis, and interpretation of data. Statisticians use statistical techniques to draw conclusions from data and make informed decisions based on that data.
For example, a Data Scientist may use probability to predict the likelihood of a customer making a purchase based on their past behavior.
Different types of Statistics
Descriptive statistics
It is used to describe and summarize a set of data. This includes calculating measures of central tendency (such as the mean and median), as well as measures of dispersion (such as the range and standard deviation).
Let us go through some of the basic terms that in statistics
Mean: It refers to the average of a set of values.
Median : It refers to the value in the middle of a data set.
Range : The range of observations is the value that is obtained from the difference between the highest and lowest values.
Standard Deviation : It refers to the measure of how dispersed the data is with respect to the mean. Low standard deviation means data are clustered around the mean, and high standard deviation indicates data are more spread out.
Inferential statistics
Inferential statistics are used to derive conclusions about a wider population based on a data sample. This involves using statistical tests to determine the likelihood that a particular result occurred by chance. There are three major categories of inferential statistics: hypothesis testing, confidence intervals, and regression analysis.
Topics to Learn in Statistics for Data Science
Probability:
Probability is the study of the likelihood of different events occurring. It is important for Data Scientists to understand probability because it is used to make predictions about future events and to understand the likelihood of different outcomes. Understanding basic concepts of probability, such as probability distributions, conditional probability, and Bayes’ Theorem, is important for Data Science.
Exploratory Data Analysis:
Exploratory Data Analysis is the process of exploring and summarizing data to understand its patterns and trends. It is an important first step in any Data Analysis project, and involves techniques such as visualizing data through graphs and plots, and calculating summary statistics.
Hypothesis Testing:
This is a statistical method used to determine whether a particular result is statistically significant, or whether it is likely to have occurred by chance. It is an important tool for Data Scientists because it allows them to test the validity of their findings.
For example, It has been proposed by Trump that anti-malaria tablets could cure COVID-19. This proposition would become our null hypothesis. It has not been proven that it cures COVID-19, it is only proposed and there is no significant proof of it.
Now a researcher comes up and says that no, the anti-malaria tablet doesn’t cure COVID-19. This would become our alternate hypothesis.
When we deal with the hypothesis, we never prove that a hypothesis is correct. We just prove that the alternate hypothesis is incorrect. That is, researchers would have to come up with significant results to prove their proposition. If they fail to do so, we would accept that anti-malaria tablets cure COVID-19.
So, performing hypothesis testing helps validate our assumptions statistically.
Regression analysis:
Regression analysis is a statistical method deployed to understand the relationships between different variables and to make predictions about one variable based on the values of others. It is commonly used in Data Science to build predictive models.
These topics, including descriptive and inferential statistics, will give a strong understanding and hold of statistics for Data Science aspirants.
Conclusion
Overall, statistics and Data Science are essential for understanding and making sense of the vast amounts of data that are generated in today’s world. Whether you are a researcher, a business analyst, or a data-driven decision maker, these fields can provide valuable insights and help you make informed decisions.
If statistics and all things Data Science tickle your brain cells, sign up for our Full Stack Data Science program to carve a career in this monumentally growing field.
Read our recent blog on “Excel for Data Analysis: The top formulas you need to know”.


