


Whether you’re a beginner or an experienced Data Scientist, incorporating these libraries into your workflow can help you become more efficient and effective. With Numpy, pandas, Matplotlib, Seaborn, and more, you will have everything you need to clean, analyze, and visualize your data like a pro. So, why wait? Start harnessing the power of these essential Python libraries today and take your Data Science skills to the next level!
The article includes the following:
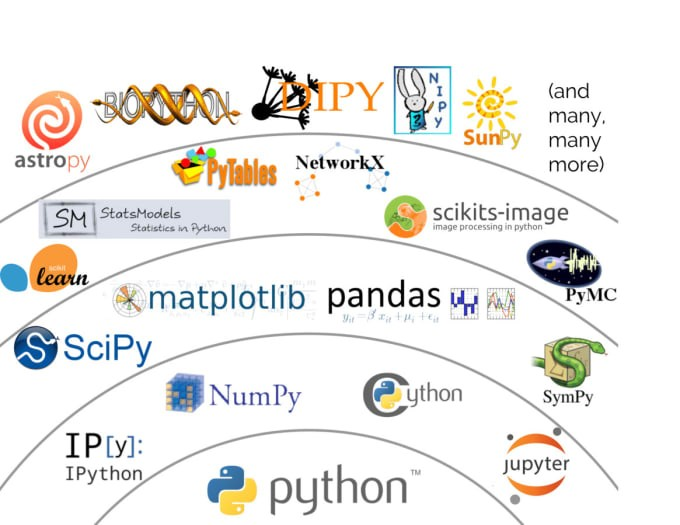
- Important Python libraries used for Data Science
- Pandas for Data Analysis
- Numpy for Math Operations on Arrays
- SciPy for Scientific and Technical Computing
- Beautifulsoup for Web Scraping
- Matplotlib for Visualization
- Tensorflow for Deep Learning Applications
- Scrapy for Web Crawling
Important Python libraries used for Data Science:
Pandas: It is a library used for data manipulation and analysis. It helps in cleaning and preprocessing data, making it easier to work with. For example, consider the scenario when you have a large dataset of student data. In that case, you can use Pandas to filter out specific columns, sort data based on certain criteria, and perform fundamental statistical analysis.
Numpy: It is a library for scientific computing and numerical analysis. It helps in performing mathematical operations on arrays, vectors, and matrices. For example, you can use Numpy to determine the average of a set of numbers.
SciPy: It is a library for scientific computing and data analysis. It provides functions for optimization, integration, interpolation, and other operations. For example, you can use SciPy to conduct regression analysis if you have a set of data points and want to find the mathematical function that best fits the data.
Beautifulsoup: It is a library used for web scraping and data extraction. It helps extract data from websites and store it in a structured format. For example, if you want to extract information about the latest movies from a movie database website, you can use Beautifulsoup.
Matplotlib: It is a library for data visualization. It helps in creating various types of plots, graphs, and charts. For example, you may use Matplotlib to create a bar graph to visualize data on the number of books sold by various authors.
Tensorflow: It is a library for machine learning. It provides various tools and algorithms for creating, training, and deploying machine learning models. For example, TensorFlow can be used to create a machine learning model that forecasts stock prices.
Scrapy: It is a library for web scraping and data extraction. It helps extract data from websites and store it in a structured format. For example, if you want to extract information about the latest news from a website; you can use Scrapy.
Pandas for Data Analysis:
Pandas is an open-source library for data analysis in Python that makes it easier to work with large amounts of data. Moreover, it’s constructive when dealing with relational data, which can be connected to other data.
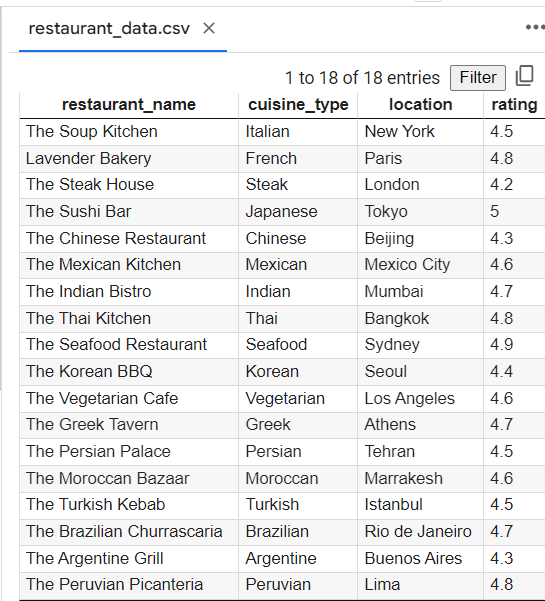
For example, imagine you have a spreadsheet with information about different restaurants, like the type of cuisine they serve, the location, and the average rating. With pandas, you can easily connect all this information and find out which kind of cuisine is the most popular in a specific area or which restaurant has the highest average rating.
Pandas also make it easy to manipulate data, so you can clean and process it differently. For example, you could remove any restaurants with a low rating or group the restaurants by cuisine type to see which type is the most popular.
An example restaurant data.csv file with 20 records is given below:
Python code illustration showing how to utilize pandas for data analysis:
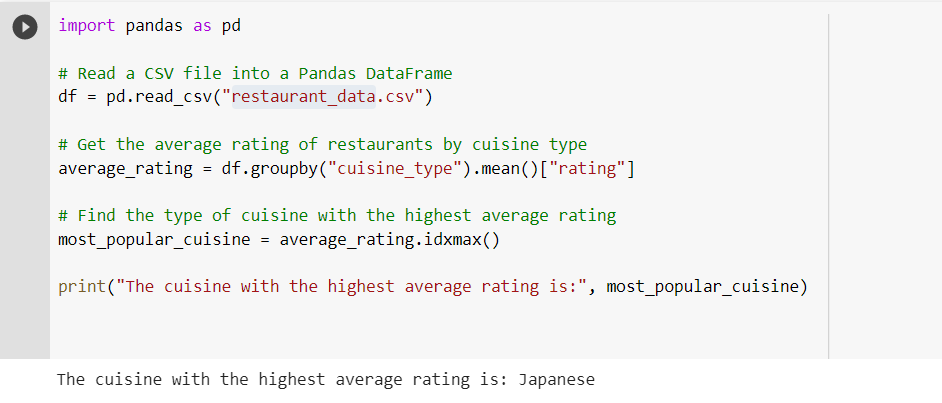
In this example, we first import the pandas library using the import pandas as a pd statement. Then, we read a CSV file containing information about restaurants into a pandas DataFrame using the pd.read_csv() function.
Next, we use the groupby function to group the data by cuisine type and calculate the average rating for each group. The mean() function returns the average values, and the rating column is selected using the bracket notation [].
Finally, we use the idxmax() function to find the type of cuisine with the highest average rating and store it in the most_popular_cuisine variable. The result is then printed to the console.
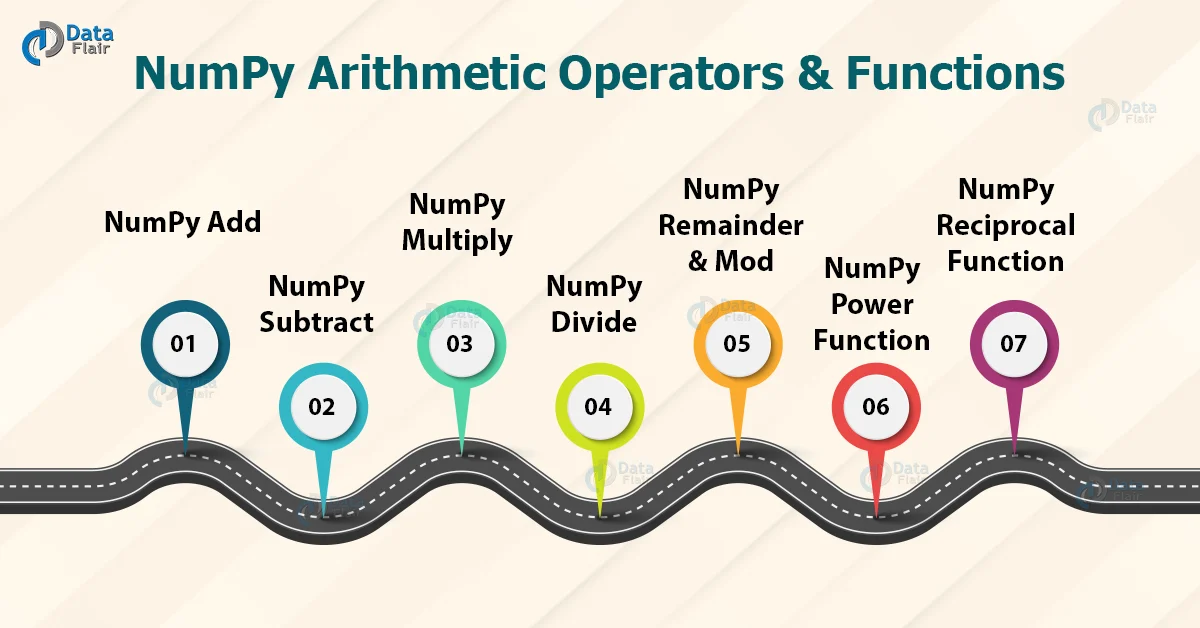
Numpy for Math Operations on Arrays:
We can use the Python package numpy to perform mathematical operations on arrays. An array is a collection of numbers or values, and numpy makes it easy to perform mathematical functions on arrays, even the multi-dimensional ones.
For example, imagine you have a list of height measurements for a group of people. With numpy, you can efficiently perform operations like finding the average height, sorting the heights in ascending or descending order, and finding the minimum and maximum height.
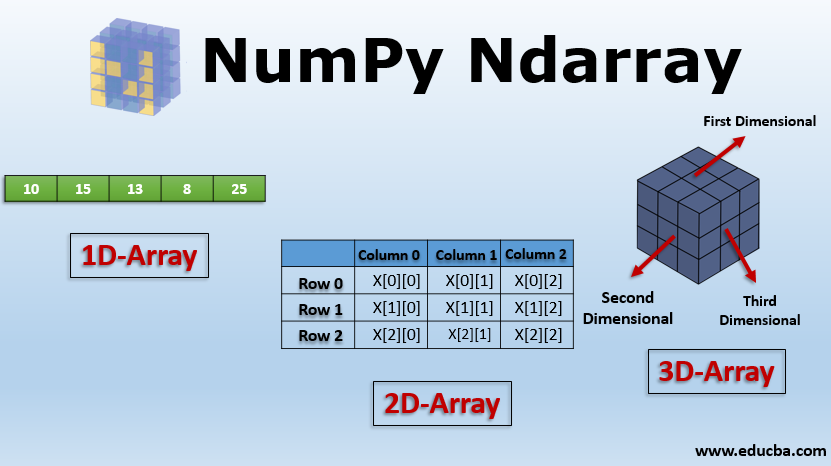
Numpy is also great for working with matrices, multi-dimensional arrays used in many mathematical and scientific calculations. With numpy, you can perform operations like matrix multiplication, inversion, and determinant calculation.
Overall, a powerful library called numpy makes it simple to carry out mathematical operations on arrays and matrices. Whether you are working on a scientific project or need to perform some simple calculations, it is a great tool to have in your toolbox.
Here is a simple code example in Python that demonstrates how you can use numpy for mathematical operations on arrays:
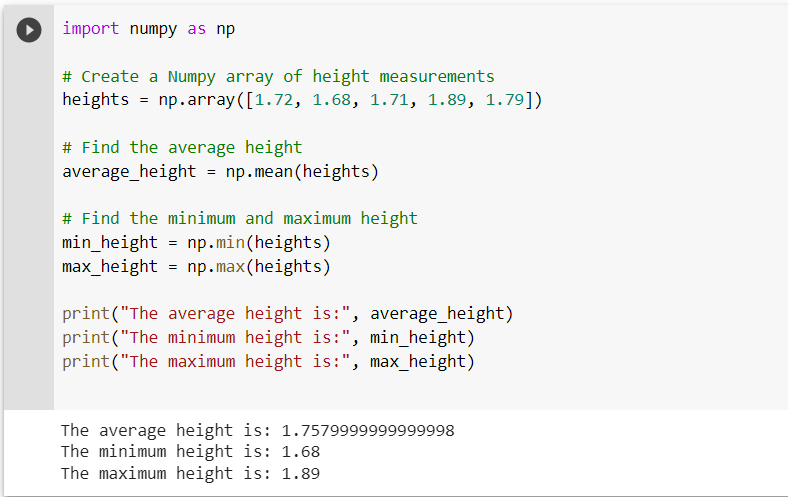
In this example, we first import the numpy library using the import numpy as np statement. Then, we create a numpy array of height measurements using the np.array function.
Next, we use the np.mean function to find the average height and the np.min and np.max functions to find the minimum and maximum height, respectively.
Finally, the results are printed on the console.
This is just a simple example, but it shows how easy it is to use numpy for mathematical operations on arrays in Python.
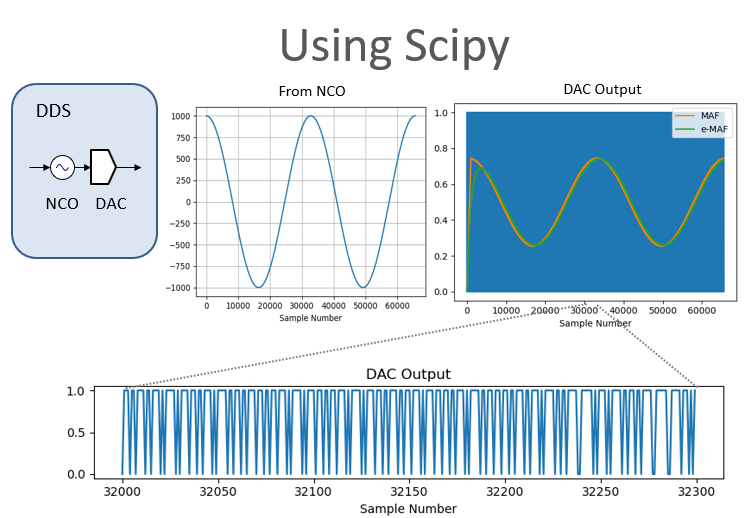
SciPy for Scientific and Technical Computing:
SciPy is a Python library that provides various scientific and technical computing tools. It includes multiple mathematical algorithms, signal-processing tools, and statistical functions.

For example, imagine you are working on a project that requires you to analyze a large amount of data. SciPy provides tools that make it easy to perform complex mathematical operations on this data, such as finding the derivatives, integrals, and fourier transforms.
SciPy also provides signal processing tools that help you work with audio and image data. For example, you can use SciPy to filter noisy signals, extract features from audio signals, or perform image processing tasks like resizing and edge detection.
In addition, SciPy provides a wide range of statistical functions that make it easy to analyze and interpret data. For example, you can use SciPy to fit models to your data, perform hypothesis tests, or calculate summary statistics like mean, median, and standard deviation.
Overall, SciPy is a powerful library that provides a wide range of scientific and technical computing tools that are useful for various applications. Whether you’re working on a scientific research project or a data analysis project, SciPy is a great tool to have in your toolbox.
Here is a simple code example in Python that demonstrates how you can use SciPy for scientific and technical computing:
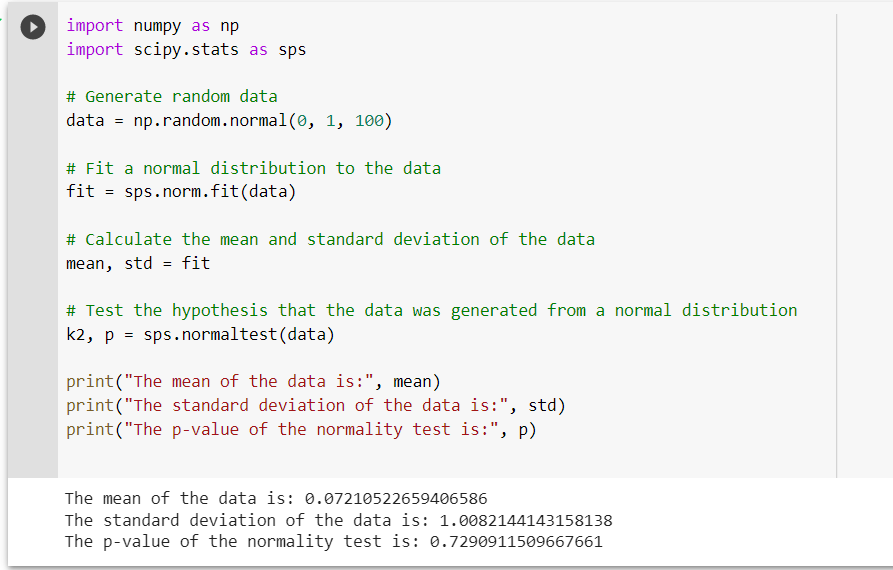
In this example, we first import the Numpy and SciPy libraries using the import numpy as np and import scipy.stats as sps statements, respectively. Then, we generate some random data using np.random.normal function.
Next, we fit a normal distribution to the data using the sps.norm.fit function. This function returns the mean and standard deviation of the normal distribution that best fits the data.
Finally, we perform a normality test on the data using the sps.normaltest function. This function returns the test statistic and p-value that can be utilized in testing the hypothesis that the data was generated from a normal distribution.
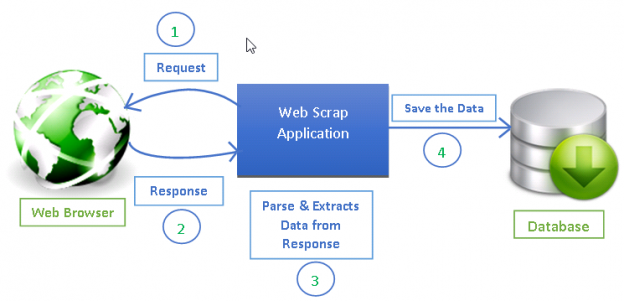
Beautifulsoup for Web Scraping:
Beautifulsoup is a library in Python that makes it easy to scrape and parse data from websites. It is beneficial for extracting data from raw web pages written in HTML or XML.
For example, imagine you are working on a project that requires you to gather information from multiple websites. You could use Beautifulsoup to extract the text, links, images, or other content from these websites and store it in a convenient format for further analysis.
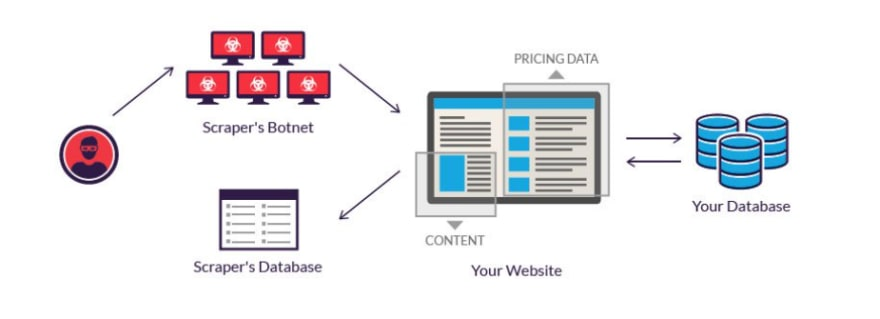
Beautifulsoup works by parsing the raw HTML or XML data from a web page and turning it into a structure that is easy to work with in Python. It provides methods for searching and navigating the data and functions for cleaning and transforming the data.
In addition, Beautifulsoup is designed to be fast and efficient, so it can handle large amounts of data without slowing down your computer. And, because it is open-source software, it is free to use and can be easily customized to meet your specific needs.
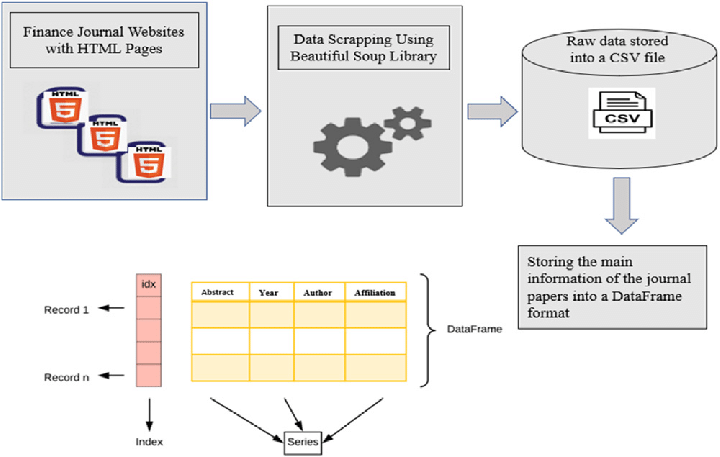
Overall, Beautifulsoup is a powerful library for web scraping and data extraction. Whether you are working on a research project, a marketing campaign, or a data analysis project, Beautifulsoup is a great tool to have in your toolbox.
Here is a simple code example in Python that demonstrates how you can use Beautifulsoup for web scraping:
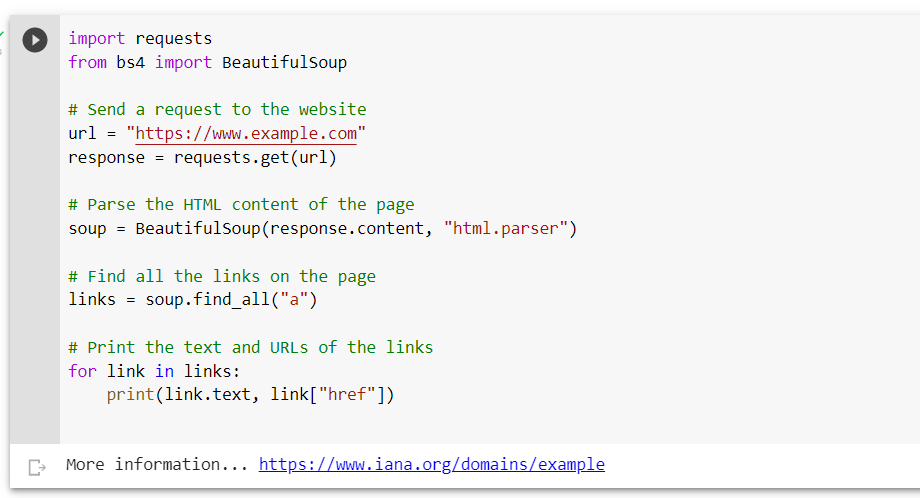
In this example, we first send a request to the website using the requests.get function. This function returns the raw HTML content of the page, which we then parse using the BeautifulSoup function.
Next, we use the soup.find_all method to find all the links on the page. It returns a list of all the tags on the page, which we can then loop through to extract the text and URLs of the links.
Finally, we use the print function to display the text and URLs of the links.
Matplotlib for Visualization:
Matplotlib is a library in Python that allows you to create beautiful and interactive visualizations. It is an object-oriented API, meaning you can easily create complex visuals with just a few lines of code.
For example, let’s say you have data on the sales of different products over the past year. You can use Matplotlib to create a bar chart that shows the sales of each product and make it interactive by adding tooltips and zooming.
Matplotlib has many plotting functions that allow you to create anything from simple line charts to 3D animations. It also has several customization options, making your visualizations look precisely how you want.
In addition to its rich graphical plotting capabilities, Matplotlib is also optimized for performance, so you can create and display large datasets without lag. And, because it is open-source software, it is free to use and can be easily extended with additional features or plugins.
Here is a simple code example in Python that demonstrates how you can use Matplotlib for visualization:
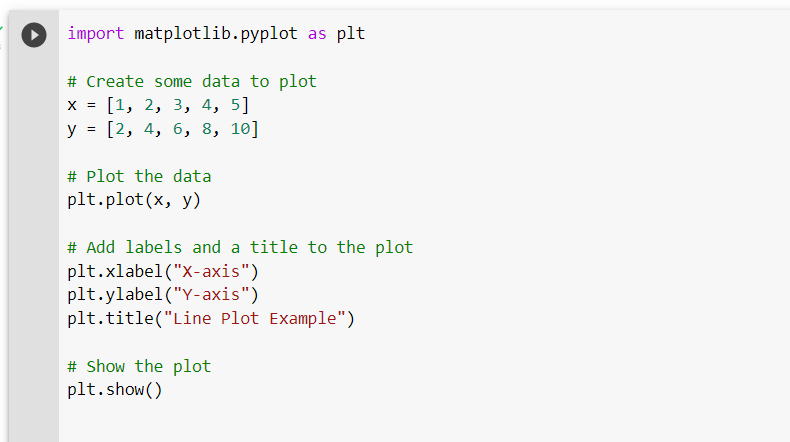
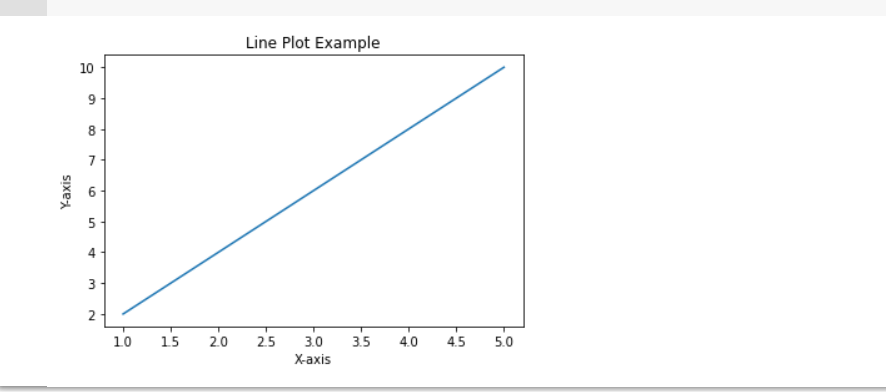
In this example, we first import the matplotlib.pyplot library, which we refer to as plt. Next, we create some data to plot, which in this case is a simple set of x and y values.
Next, we use the plt.plot function to plot the data. This function takes two arguments, the x and y values, and creates a line plot of the data.
Finally, we use the plt.xlabel, plt.ylabel, and plt.title functions to add labels and a title to the plot, and we use the plt.show function to display the plot.
Tensorflow for Deep Learning Applications:
TensorFlow is a library in Python that is designed for deep learning applications. It is a powerful tool for building complex machine-learning models, and many researchers and businesses use it to create innovative products and services.
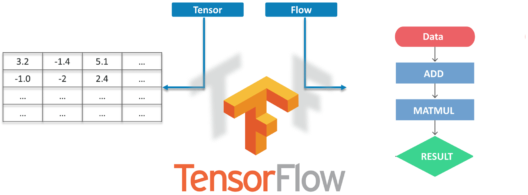
At its core, Tensorflow is a data flow graph framework that allows you to perform mathematical computations on large amounts of data. For example, you can use TensorFlow to build regression algorithms, neural networks, and machine-learning models.
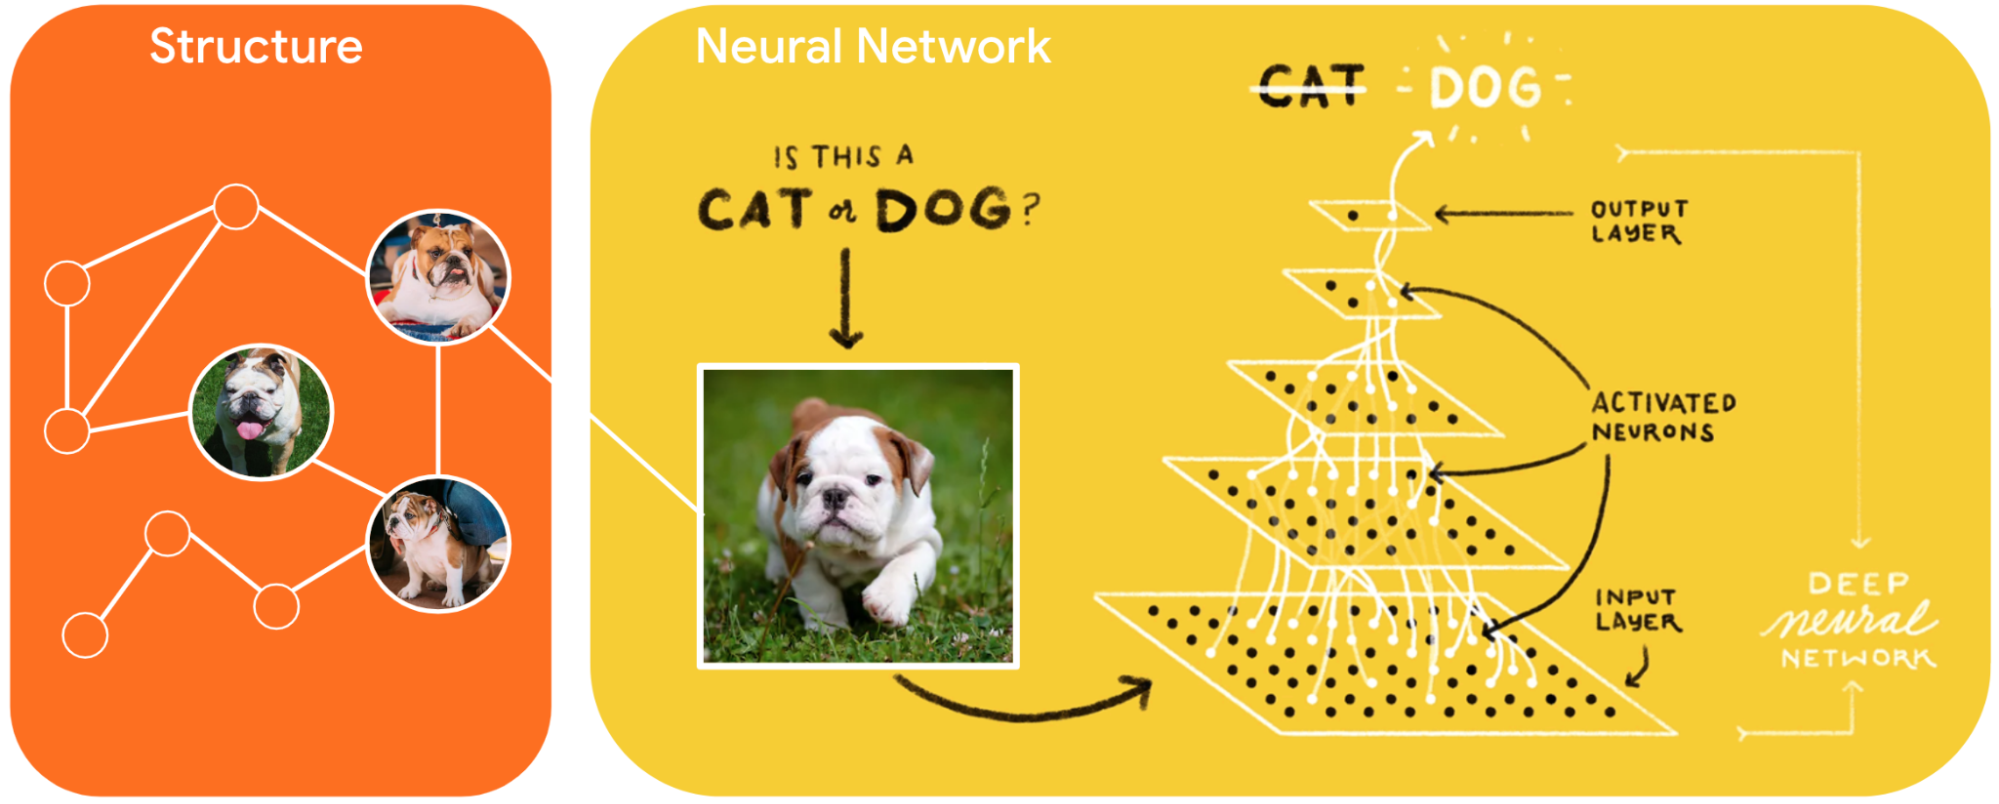
One of the critical strengths of Tensorflow is that it allows you to train your machine-learning models, using your data efficiently. For example, if you have a large dataset of images, you can use TensorFlow to build a convolutional neural network that automatically recognizes objects in the pictures.
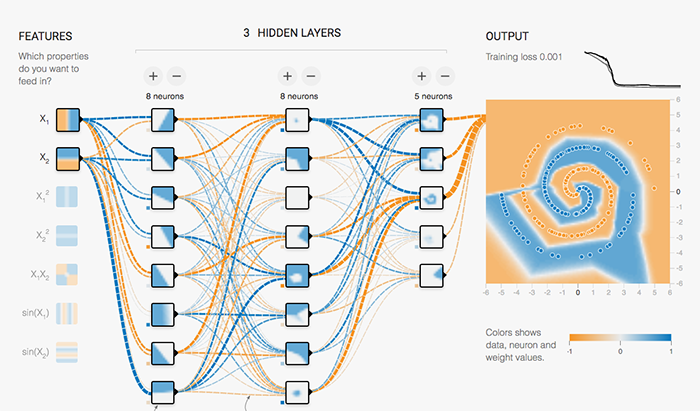
Tensorflow is highly flexible and can be used for various applications, from natural language processing to computer vision. It is also optimized for performance, so you can train large models and process large datasets without sacrificing speed.
Here is a simple code example in Python that demonstrates how you can use TensorFlow for deep learning:
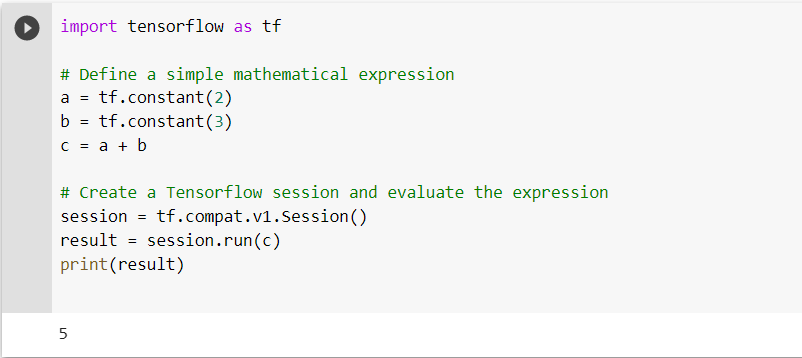
In this example, we first import the TensorFlow library, which we refer to as tf.
Next, we define a simple mathematical expression that adds two constants together. We use the tf.constant function to determine the constants and the + operator to perform the addition.
Next, we create a Tensorflow session using the tf.Session function. This session is used to evaluate the expression that we defined earlier.
Finally, we use the session.run function to evaluate the expression, and we print the result to the console.
Scrapy for Web Crawling:
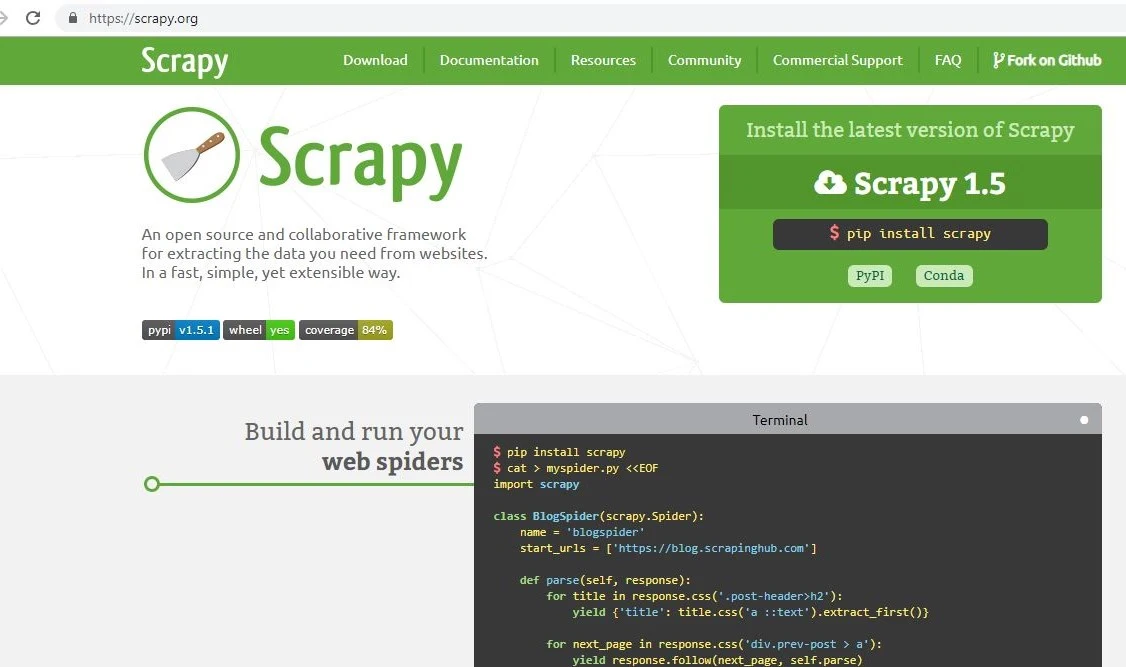
Scrapy is a robust open-source web crawling framework used to extract structured data from websites. It is designed to be fast, efficient, and scalable, making it an ideal tool for large-scale web scraping projects.
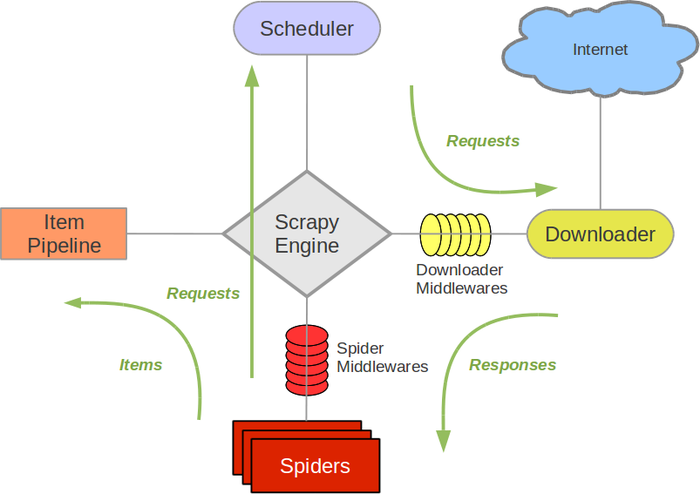
At its core, Scrapy provides a batteries-included approach to web crawling, which means it comes with all the tools and features you need to get started. For example, you can use Scrapy to extract data from websites, store it in a structured format, and analyze it using various techniques.
One of the critical strengths of Scrapy is that it provides a simple and intuitive API that makes it easy to extract data from websites. For example, if you want to extract all the product names and prices from an online store, you can use Scrapy to write a simple script that will do that for you.
Another essential feature of Scrapy is that it can easily handle complex and large-scale web scraping projects. For example, if you want to extract data from thousands of websites, Scrapy can help you do that quickly and efficiently.
Here is a simple code example in Python that demonstrates how you can use Scrapy for web crawling:
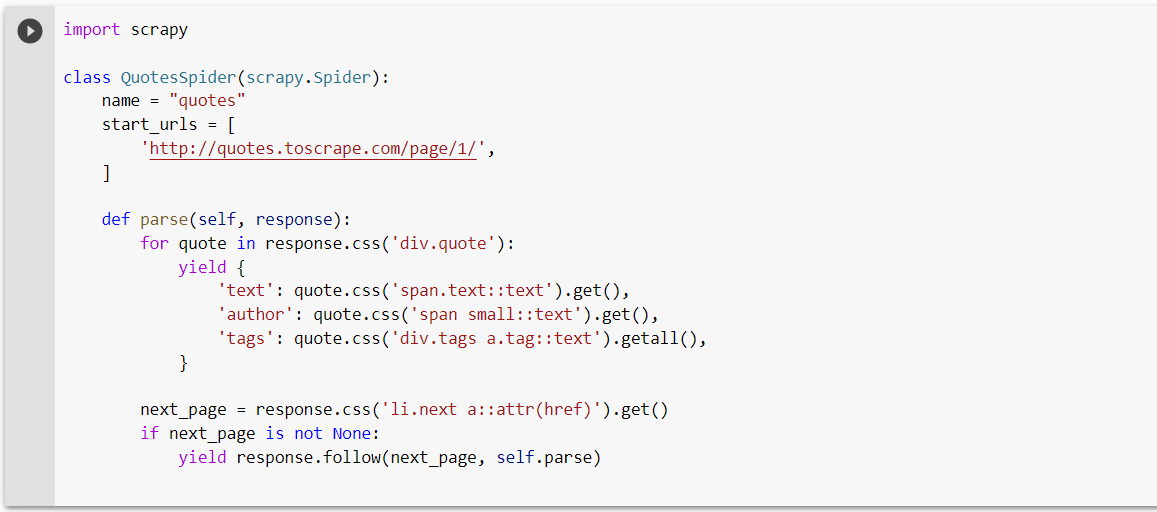
In this example, we import the scrapy library and create a class named QuotesSpider that extends the scrapy.Spider class.
This class defines the basic structure of a Scrapy spider and includes the following:
- A name
- A list of start URLs
- A parse method that extracts the data we are interested in
The parse method uses CSS selectors to extract the page’s text, author, and tags of each quote. It then yields a dictionary that contains the extracted data.
Finally, the parse method checks to see if there is a link to the next page, and if there is, it yields a response that follows that link and continues to scrape the next page.
Read our recent blog on "NetworkX: A Python Library"
Conclusion
In conclusion, these seven libraries are essential for Data Science in Python. They provide the tools necessary for various tasks, from data analysis and manipulation to web scraping and deep learning.
Whether you are a beginner or an experienced Data Scientist, these libraries will help you work with data effectively and efficiently.
For example, pandas provide robust data analysis tools for working with relational data, Numpy is essential for performing mathematical operations on arrays, SciPy offers a range of scientific and technical computing tools, Beautifulsoup is the go-to library for web scraping and parsing HTML and XML, Matplotlib provides object-oriented APIs for creating interactive visualizations, Tensorflow is the premier library for deep learning and neural networks, and Scrapy is a robust framework for web crawling and data extraction.
Whether you are working on a project or exploring the world of Data Science, these libraries are sure to be valuable resources that will help you achieve your goals.
If you are interested in pursuing Data Science as a career, AlmaBetter’s Full Stack Data Science course could be a good fit for you.


