Your Success, Our Mission!
6000+ Careers Transformed.
What is AdaBoost? AdaBoost, short for Adaptive Boosting, is an ensemble machine learning algorithm that can be used in a wide variety of classification and regression tasks. It is a supervised learning algorithm that is used to classify data by combining multiple weak or base learners (e.g., decision trees) into a strong learner. AdaBoost works by weighting the instances in the training dataset based on the accuracy of previous classifications.
Freund and Schapire first presented boosting as an ensemble modelling approach in 1997. Boosting has now become a popular strategy for dealing with binary classification issues. These algorithms boost prediction power by transforming a large number of weak learners into strong learners.
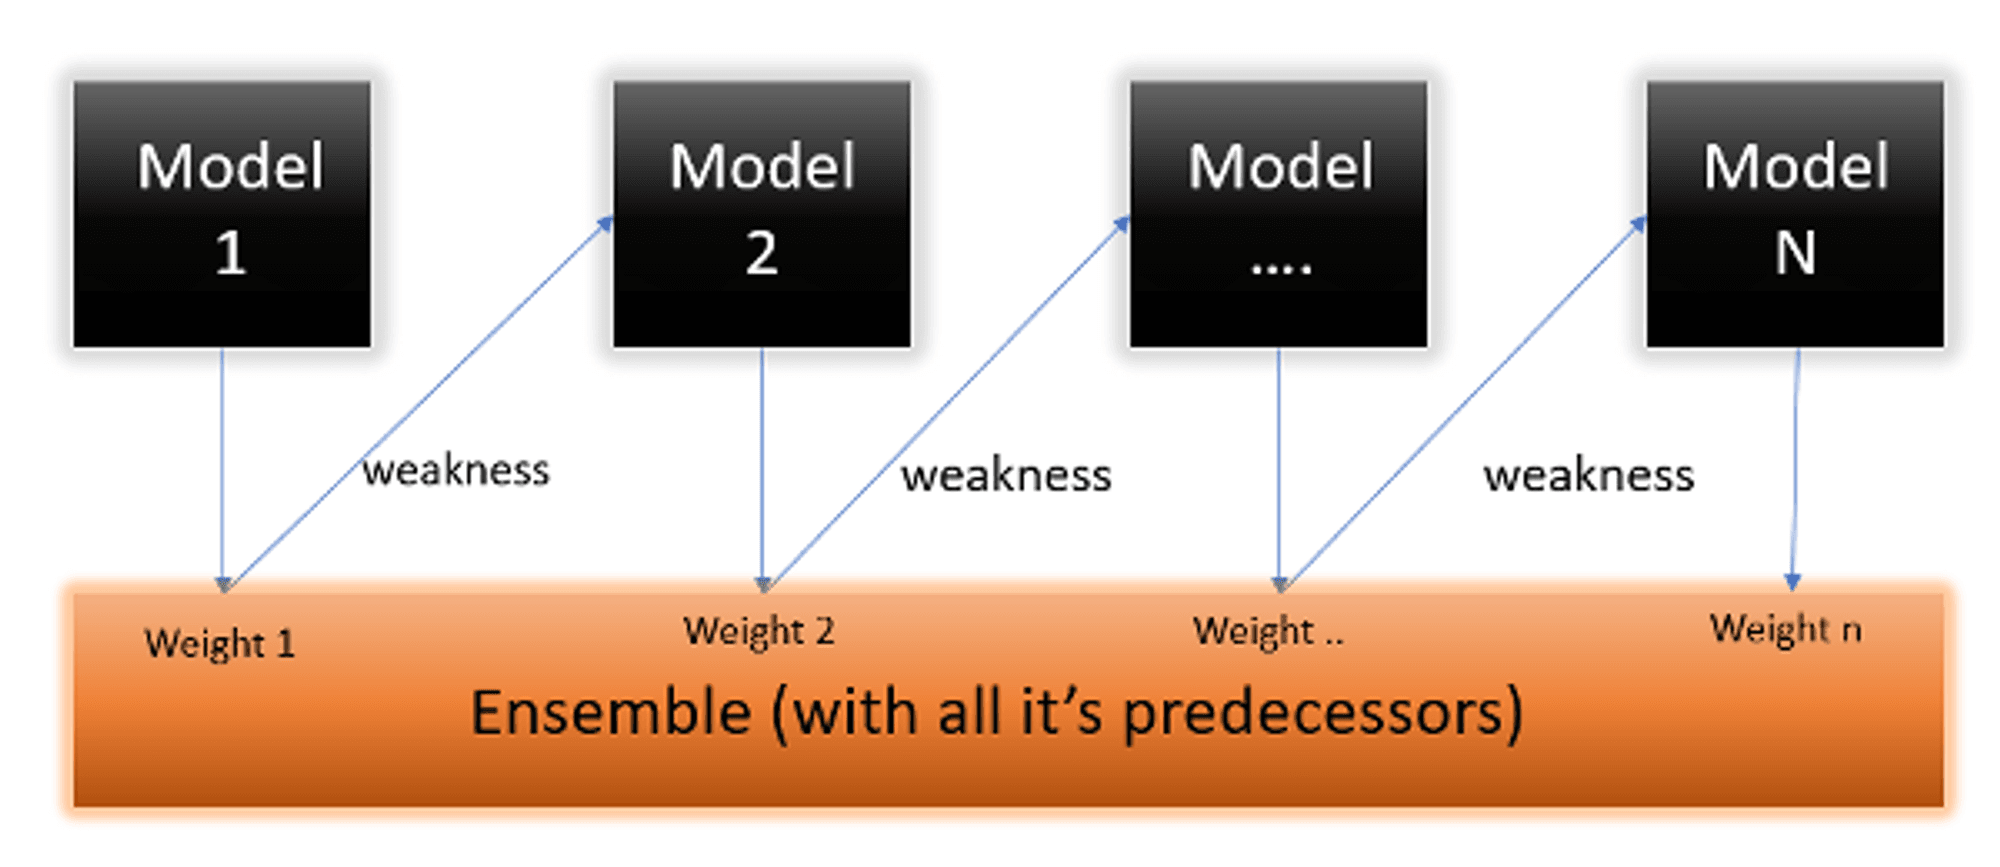
Boosting algorithms work on the idea of first building a model on the training dataset and then building a second model to correct the faults in the first model. This technique is repeated until the mistakes are reduced and the dataset is accurately predicted. Boosting algorithms function similarly in that they combine numerous models (weak learners) to produce the final result (strong learners).
There are three kinds of boosting algorithms:
Let’s understand “What is AdaBoost algorithm?”
What is AdaBoost in machine learning? There are several machine learning algorithms from which to chose for your issue statements. AdaBoost in machine learning is one of these predictive modelling techniques. AdaBoost, also known as Adaptive Boosting, is a Machine Learning approach that is utilised as an Ensemble Method. AdaBoost's most commonly used estimator is decision trees with one level, which is decision trees with just one split. These trees are often referred to as Decision Stumps.
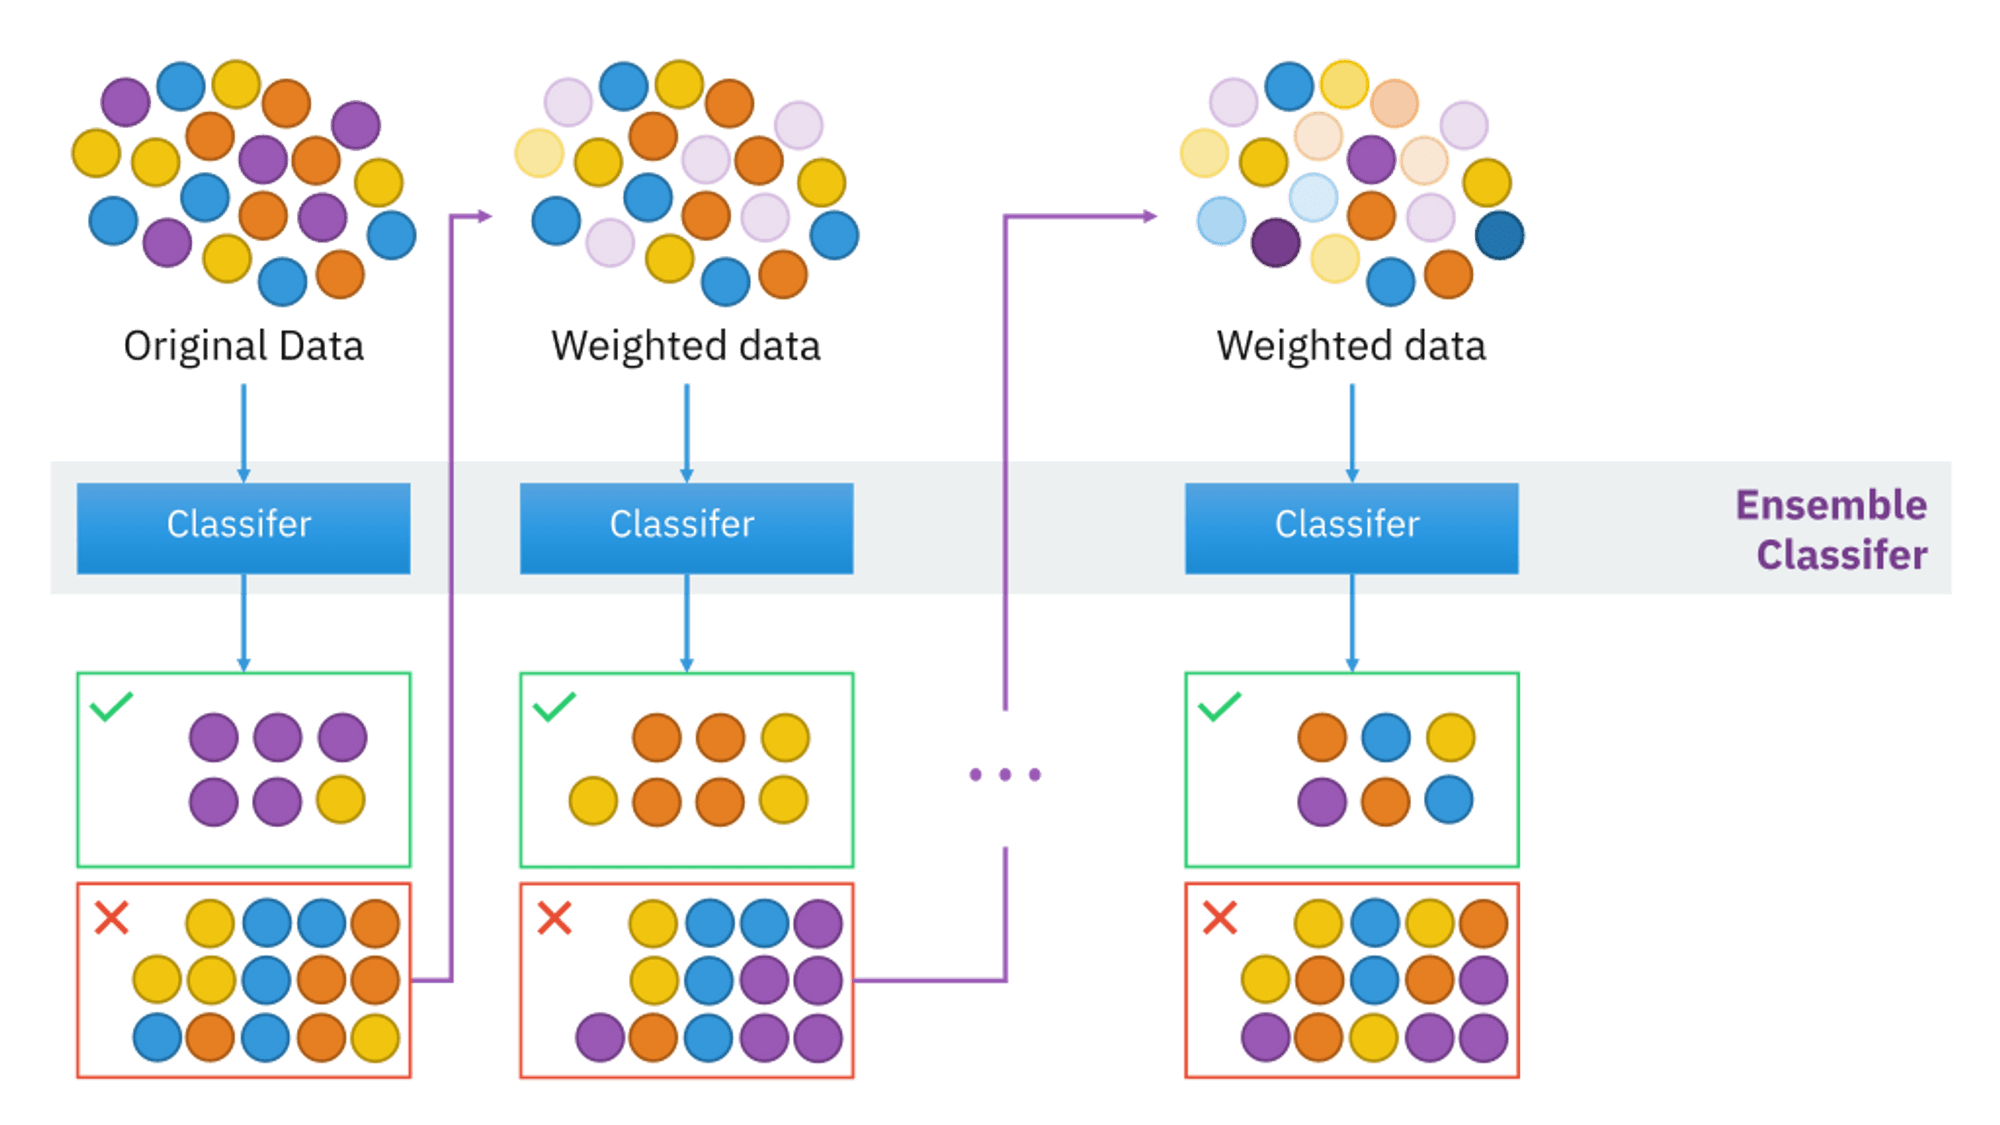
This approach constructs a model and assigns equal weights to all data points. It then applies larger weights to incorrectly categorised points. In the following model, all points with greater weights are given more weight. It will continue to train models until a smaller error is returned.
To illustrate, imagine you created a decision tree algorithm using the Titanic dataset and obtained an accuracy of 80%. Following that, you use a new method and assess the accuracy, which is 75% for KNN and 70% for Linear Regression.
When we develop a new model on the same dataset, the accuracy varies. What if we combine all of these algorithms to create the final prediction? Using the average of the outcomes from various models will yield more accurate results. In this method, we can improve prediction power.
The image below represents the adaboost algorithm example or adaboost example by taking below dataset . It is a classification challenge since the target column is binary. First and foremost, these data points will be weighted. At first, all of the weights will be equal.
| Row No. | Gender | Age | Income | Illness | Sample Weights |
|---|---|---|---|---|---|
| 1 | Male | 41 | 40000 | Yes | 1/5 |
| 2 | Male | 54 | 30000 | No | 1/5 |
| 3 | Female | 42 | 25000 | No | 1/5 |
| 4 | Female | 40 | 60000 | Yes | 1/5 |
| 5 | Male | 46 | 50000 | Yes | 1/5 |
The sample weights are calculated using the following formula:
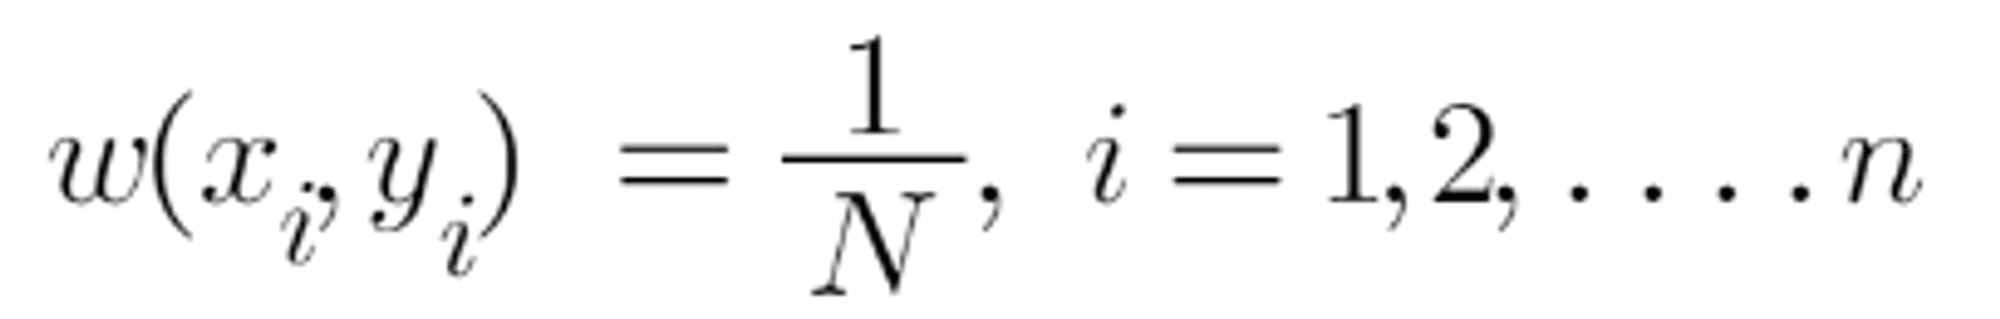
N denotes the total number of data points.
Because we have 5 data points, the sample weights will be 1/5.
We will examine how well "Gender" classifies the samples, followed by how the variables (Age and Income) categorise the samples. We'll make a decision stump for each characteristic and then compute each tree's Gini Index. Our first stump will be the tree with the lowest Gini Index.
Let's suppose Gender has the lowest gini index in our dataset, thus it will be our first stump.
Using this approach, we will now determine the "Amount of Say" or "Importance" or "Influence" for this classifier in categorising the data points:
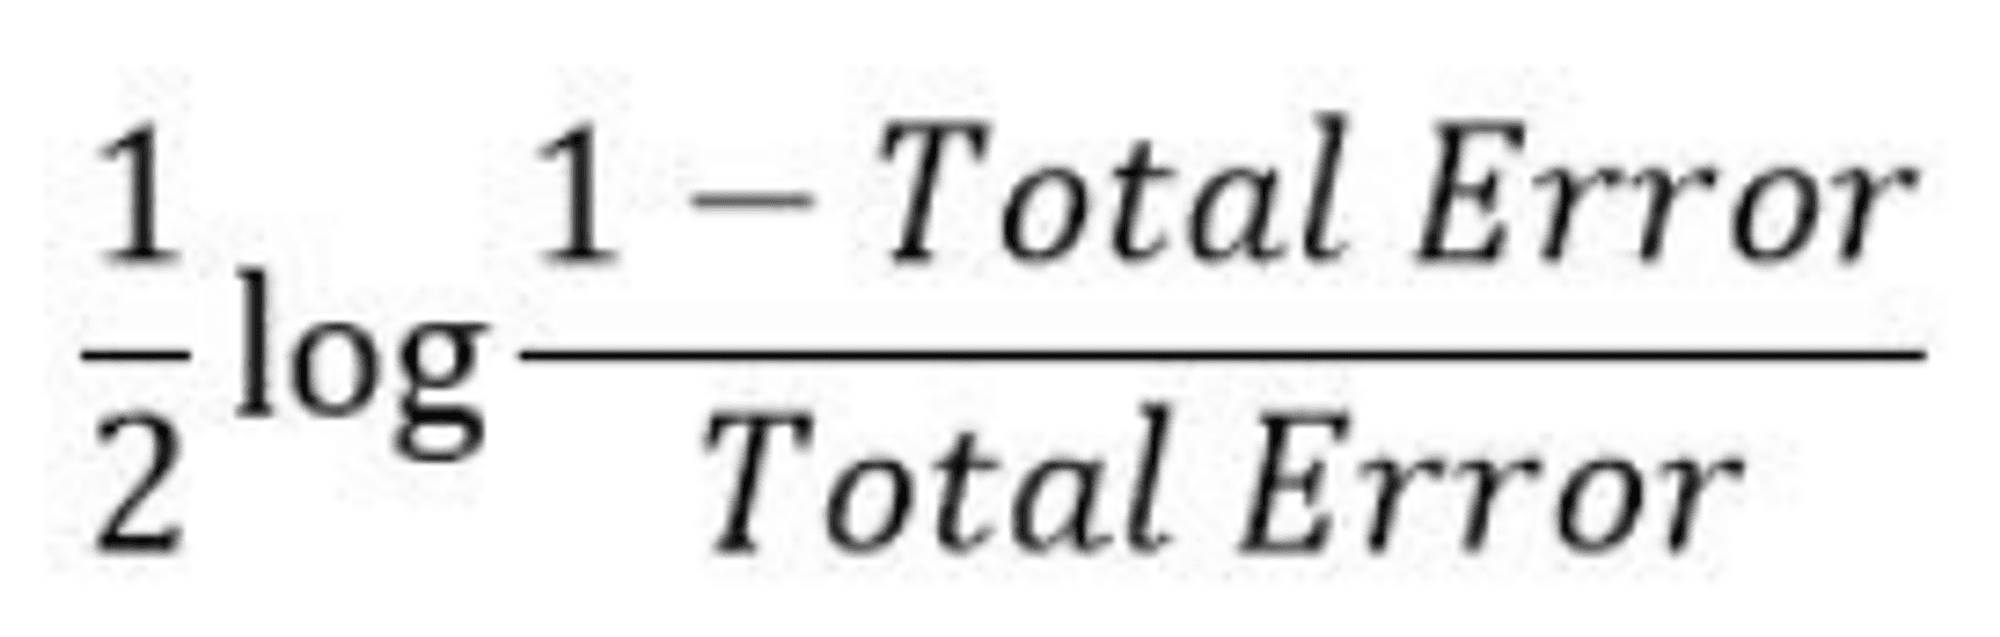
The total error is just the sum of all misclassified data points' sample weights.
If there is one incorrect output in our dataset, thus our total error is 1/5, and the alpha (performance of the stump) is: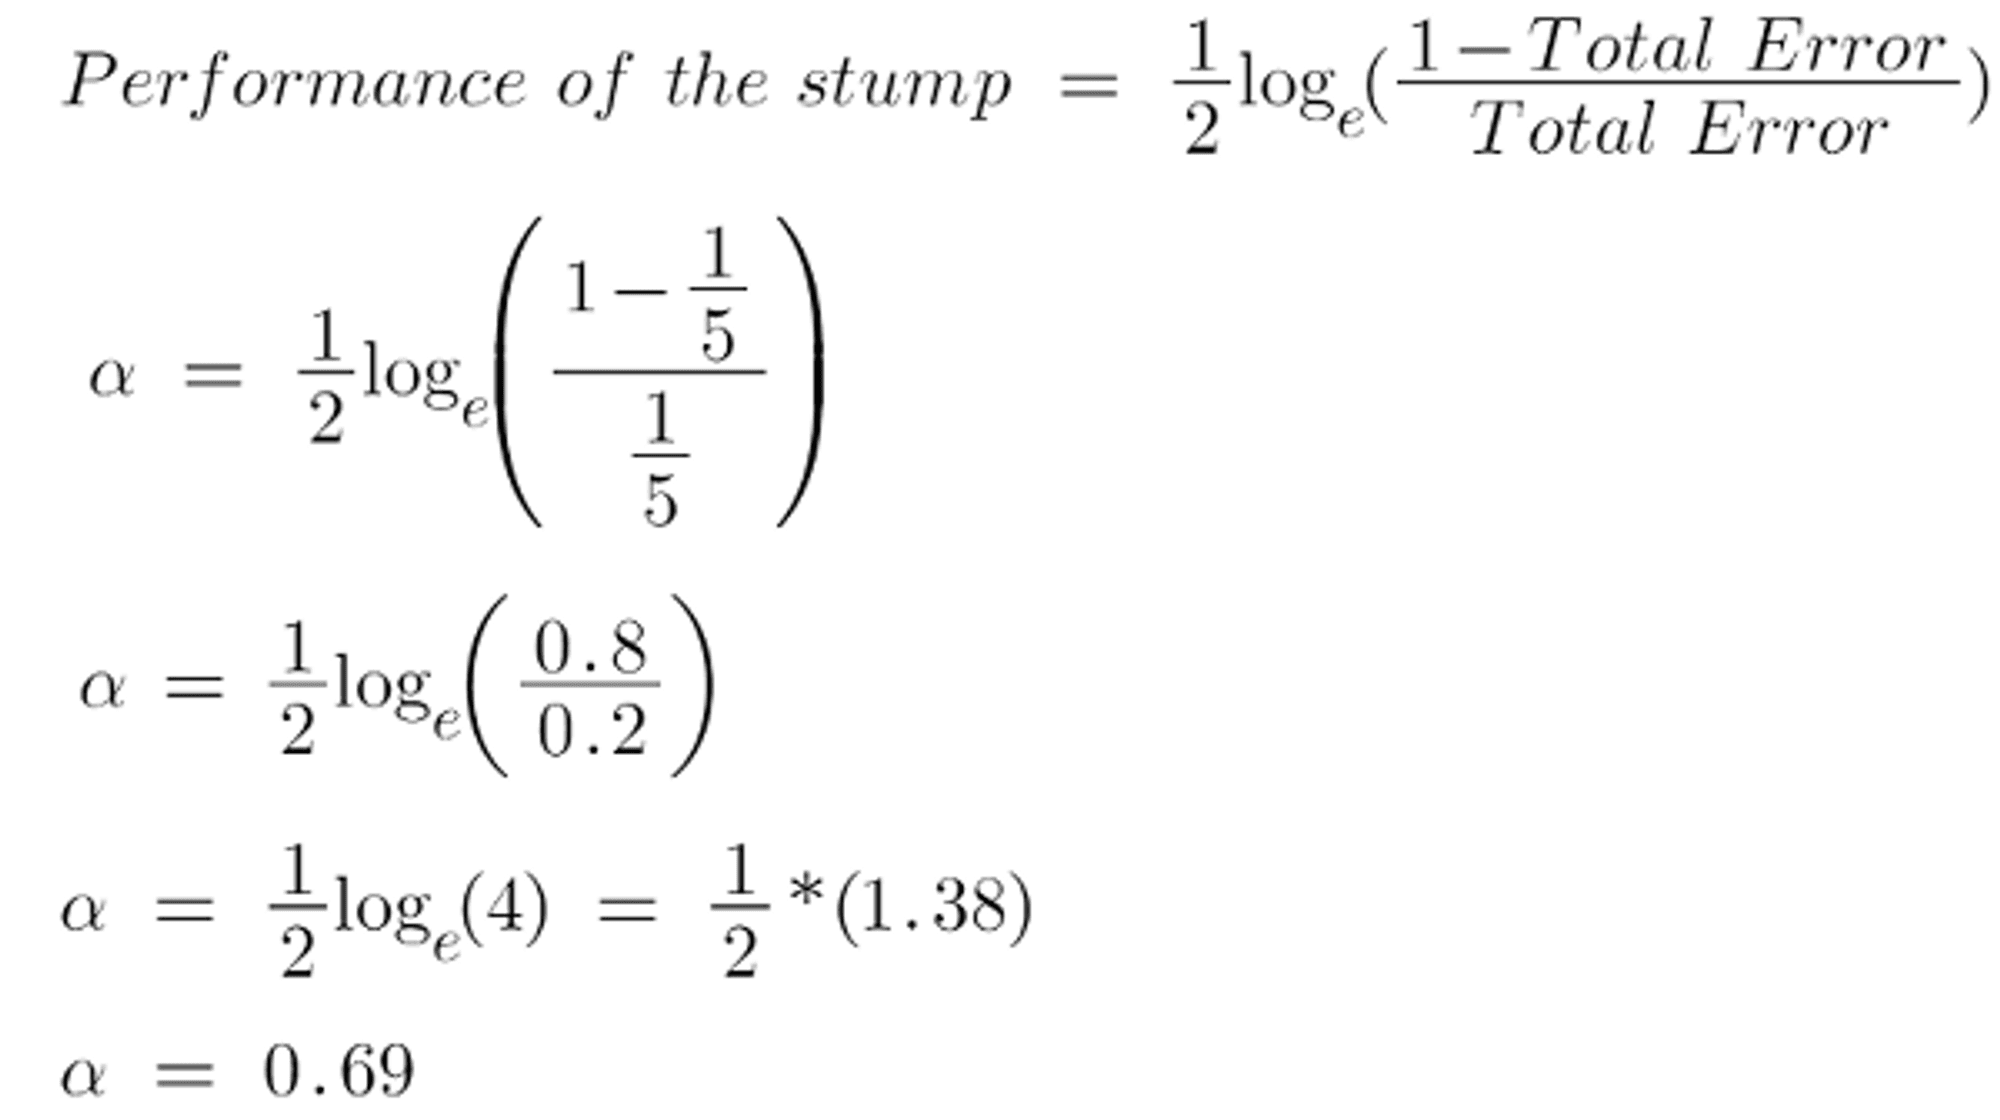
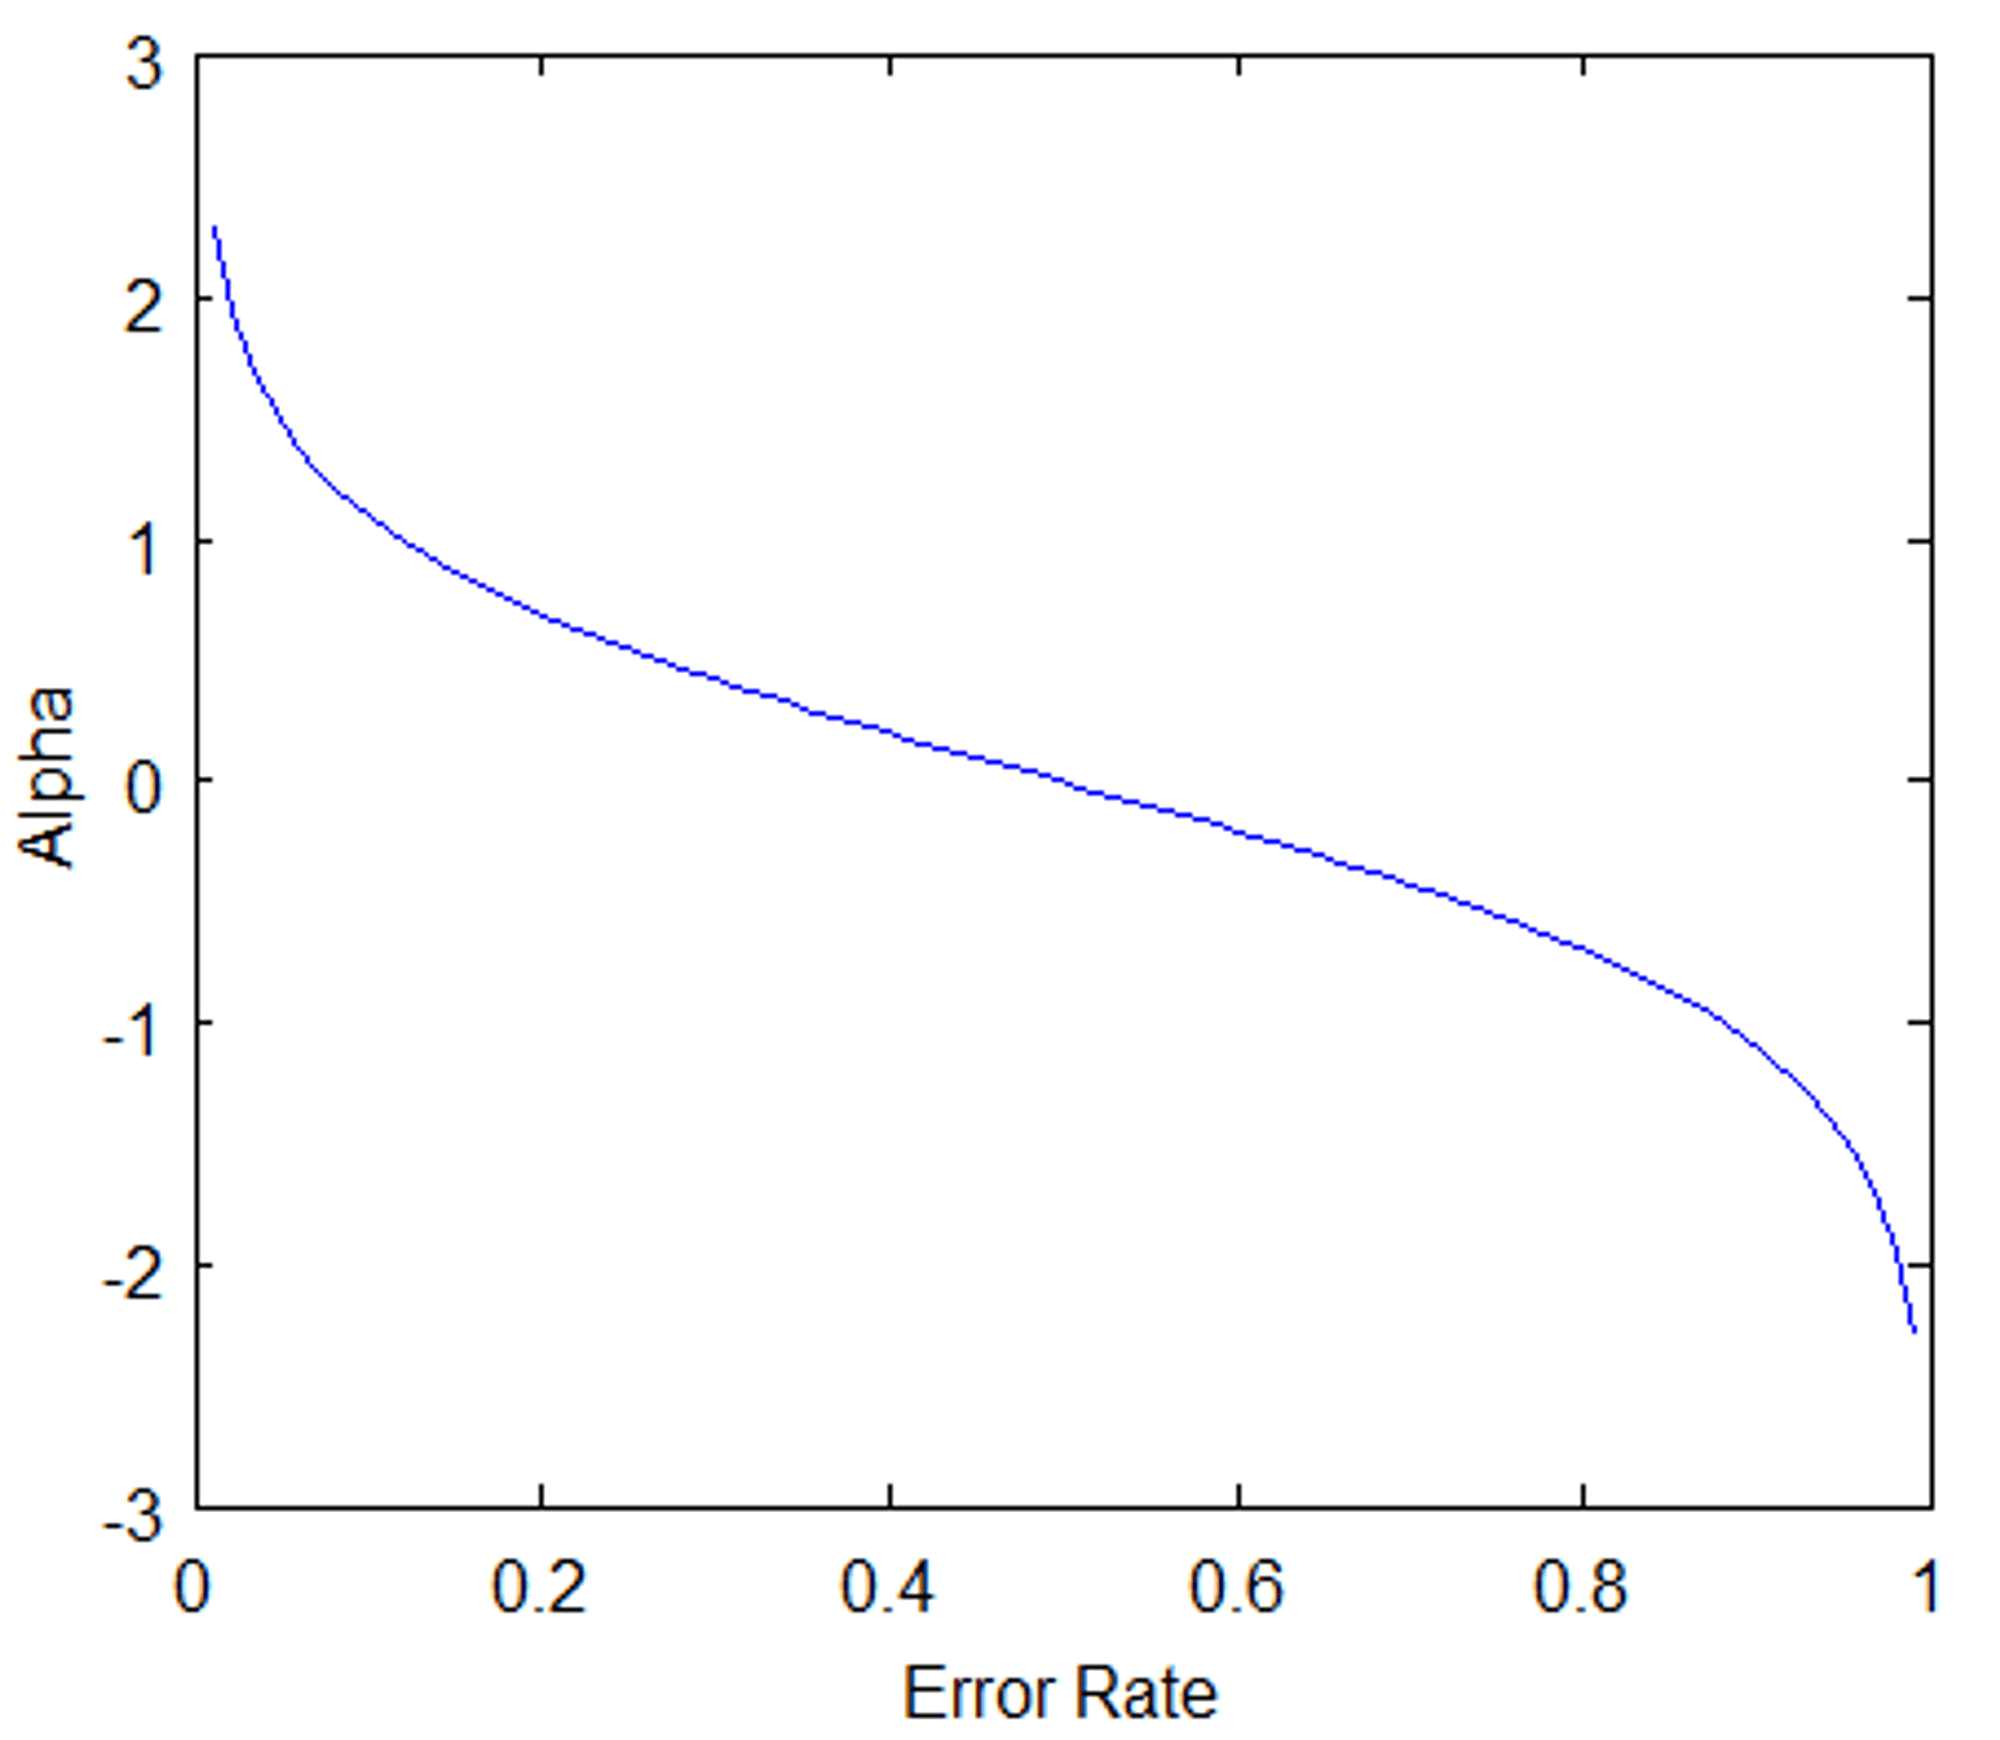
0 represents a flawless stump, while 1 represents a bad stump.
You're probably asking why it's required to determine a stump's TE and performance. The answer is simple: we need to update the weights since if the same weights are used in the next model, the result will be the same as it was in the previous model.
The weights of the incorrect forecasts will be increased, while the weights of the successful predictions will be dropped. When we create our next model after updating the weights, we will assign greater weight to the points with higher weights.
After determining the classifier's significance and total error, we must update the weights using the following formula:

The following are new weights for correctly identified samples:
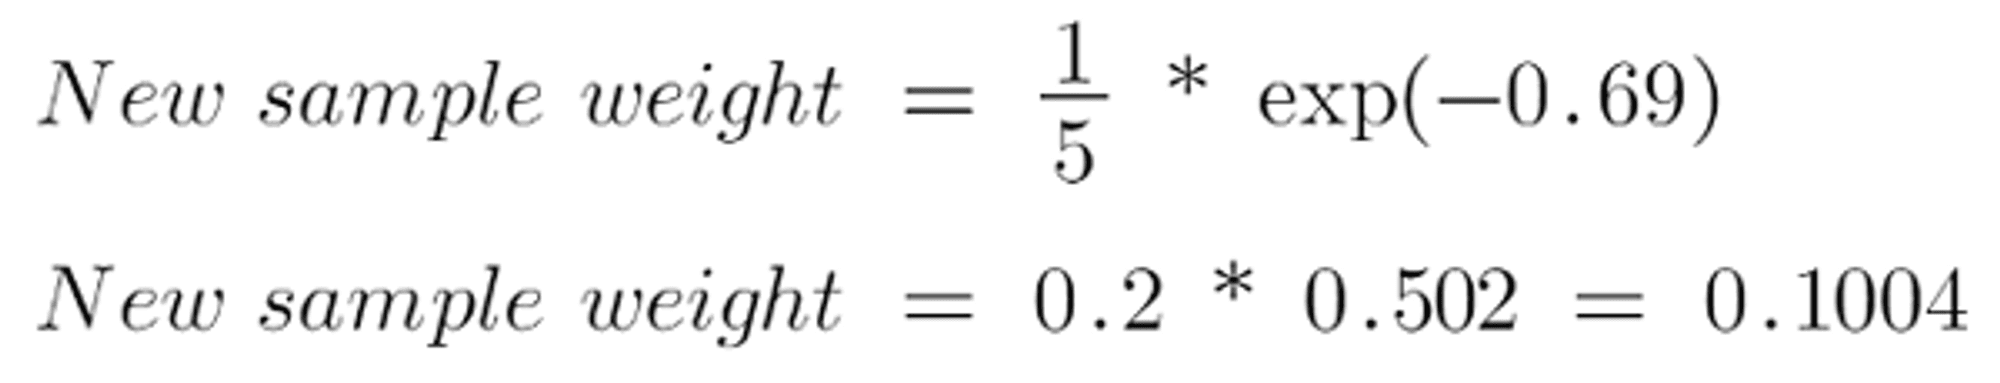
The adjusted weights for incorrectly categorised samples will be:
| Row No. | Gender | Age | Income | Illness | Sample Weights | New Sample Weights |
|---|---|---|---|---|---|---|
| 1 | Male | 41 | 40000 | Yes | 1/5 | 0.1004 |
| 2 | Male | 54 | 30000 | No | 1/5 | 0.1004 |
| 3 | Female | 42 | 25000 | No | 1/5 | 0.1004 |
| 4 | Female | 40 | 60000 | Yes | 1/5 | 0.3988 |
| 5 | Male | 46 | 50000 | Yes | 1/5 | 0.1004 |
We know that the entire sum of the sample weights must equal one, but if we add all of the new sample weights together, we get 0.8004. To get this amount equal to 1, we will normalise these weights by dividing all the weights by the entire sum of updated weights, which is 0.8004. Hence, we get this dataset after normalising the sample weights, and the sum is now equal to 1.
| Row No. | Gender | Age | Income | Illness | Sample Weights | New Sample Weights |
|---|---|---|---|---|---|---|
| 1 | Male | 41 | 40000 | Yes | 1/5 | 0.1004/0.8004 = 0.1254 |
| 2 | Male | 54 | 30000 | No | 1/5 | 0.1004/0.8004 = 0.1254 |
| 3 | Female | 42 | 25000 | No | 1/5 | 0.1004/0.8004 = 0.1254 |
| 4 | Female | 40 | 60000 | Yes | 1/5 | 0.3988/0.8004=0.4982 |
| 5 | Male | 46 | 50000 | Yes | 1/5 | 0.1004/0.8004 = 0.1254 |
We must now create a fresh dataset to see whether or not the mistakes have decreased. To do this, we will delete the "sample weights" and "new sample weights" columns and then split our data points into buckets based on the "new sample weights.”
| Row No. | Gender | Age | Income | Illness | Sample Weights | New Sample Weights | Buckets |
|---|---|---|---|---|---|---|---|
| 1 | Male | 41 | 40000 | Yes | 1/5 | 0.1254 | 0 to 0.1254 |
| 2 | Male | 54 | 30000 | No | 1/5 | 0.1254 | 0.1254 to 0.2508 |
| 3 | Female | 42 | 25000 | No | 1/5 | 0.1254 | 0.2508 to 0.3762 |
| 4 | Female | 40 | 60000 | Yes | 1/5 | 0.4982 | 0.3762 to 0.8744 |
| 5 | Male | 46 | 50000 | Yes | 1/5 | 0.1254 | 0.8744 to 0.9998 |
We're nearly there. The method now chooses random values ranging from 0 to 1. Because improperly categorised records have greater sample weights, the likelihood of picking them is relatively high.
Assume the five random integers chosen by our algorithm are 0.38,0.26,0.98,0.40,0.55.
Now we'll examine where these random numbers go in the bucket and create our new dataset, which is displayed below.
| Row No. | Gender | Age | Income | Illness |
|---|---|---|---|---|
| 1 | Female | 40 | 60000 | Yes |
| 2 | Male | 54 | 30000 | No |
| 3 | Female | 42 | 25000 | No |
| 4 | Female | 40 | 60000 | Yes |
| 5 | Female | 40 | 60000 | Yes |
This is our new dataset, and we can see that the data point that was incorrectly categorised has been picked three times since it has a greater weight.
This now serves as our new dataset, and we must repeat all of the preceding stages, i.e. Give each data point an equal weight. Determine the stump that best classifies the new group of samples by calculating their Gini index and picking the one with the lowest Gini index. To update the prior sample weights, compute the "Amount of Say" and "Total error." Normalize the newly calculated sample weights. Iterate through these procedures until a low training error is obtained.
Assume that we have built three decision trees (DT1, DT2, and DT3) sequentially with regard to our dataset. If we transmit our test data now, it will go through all of the decision trees, and we will eventually find which class has the majority, and we will make predictions for our test dataset based on that.
AdaBoost is a powerful and widely used machine learning algorithm that has been successfully applied to classification and regression tasks in a wide variety of domains. It is an effective method for combining multiple weak or base learners into a single strong learner, and has been shown to have good generalization performance. Its ability to weight instances based on previous classifications makes it robust to noisy and imbalanced datasets, and it is computationally efficient and less prone to overfitting.
1. What is the fundamental principle behind Adaboost?
Answer: A. Boosting
2.What is the main purpose of Adaboost?
Answer: B. To improve prediction accuracy
3. What is the main difference between Adaboost and Bagging?
Answer: D. Adaboost is used for classification while Bagging is used for regression
4.What is the main advantage of Adaboost over other ML algorithms?
Answer: C. It is more robust
Top Tutorials

Python
Python is a popular and versatile programming language used for a wide variety of tasks, including web development, data analysis, artificial intelligence, and more.

SQL
The SQL for Beginners Tutorial is a concise and easy-to-follow guide designed for individuals new to Structured Query Language (SQL). It covers the fundamentals of SQL, a powerful programming language used for managing relational databases. The tutorial introduces key concepts such as creating, retrieving, updating, and deleting data in a database using SQL queries.

Applied Statistics
Master the basics of statistics with our applied statistics tutorial. Learn applied statistics techniques and concepts to enhance your data analysis skills.
All Courses (6)
Master's Degree (2)
Fellowship (2)
Certifications (2)


