


Picture this —
You walk into a modern office buzzing with dashboards, reports, and data-driven decisions.
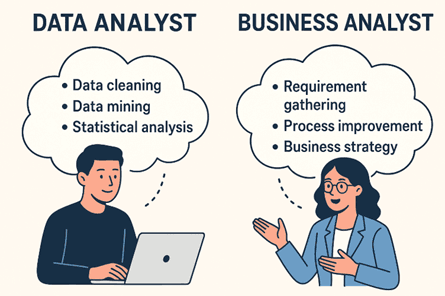
At one desk, a professional is cleaning huge datasets in Python, building dashboards in Power BI, and analyzing customer behavior.
At another, someone is leading a meeting with department heads, translating those data insights into strategies to boost revenue.
Both are working with the same data — but in entirely different ways.
One is a Data Analyst — uncovering what’s happening and why.
The other is a Business Analyst — defining what should happen next.
In today’s data-first world, these two roles form the backbone of modern business intelligence. Understanding how they differ — and where they overlap — is key if you’re planning your career in analytics or data science.
Summary
While both roles revolve around data, their perspectives, responsibilities, and ultimate goals are remarkably different.
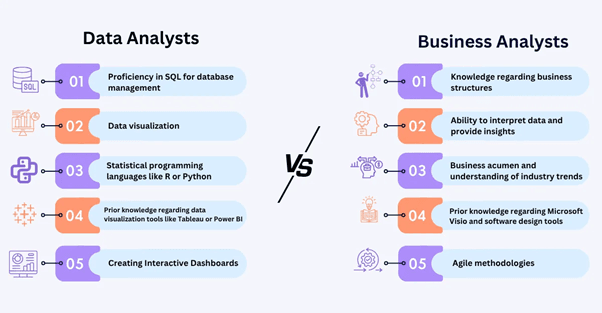
A Data Analyst (DA) focuses on the technical side of data — collecting, cleaning, transforming, and visualizing large datasets to uncover patterns and trends. They dive deep into raw numbers, using tools like SQL, Python, Excel, Power BI, and Tableau to answer the fundamental question: “What is happening and why?” Their job is to make sense of complex data and translate it into clear, actionable insights.
On the other hand, a Business Analyst (BA) operates closer to the strategic layer. They interpret those insights to shape business goals, design workflows, and recommend actions that drive measurable impact. While they may not code as extensively, they possess strong analytical reasoning, process understanding, and communication skills. Their guiding question is: “How can we use this data to improve the business?”
Together, these two roles form a powerful partnership — the Data Analyst provides the factual foundation through analysis and evidence, while the Business Analyst builds the bridge between insights and execution.
In essence —
Data Analysts turn data into stories that explain what’s happening.
Business Analysts turn those stories into strategies that shape what happens next.
This article explores both paths in detail — diving into their roles, responsibilities, tools, workflows, skillsets, career progression, and most importantly, how to decide which one aligns best with your interests and long-term goals in the analytics landscape.
Table of Contents
Who is a Data Analyst?
Who is a Business Analyst?
Key Differences Between the Two
Soft Skills Requirement
Real-World Use Cases Across Industries
Career Path, Growth, and Salaries
Which Role is Right for You?
Conclusion
Additional Readings
Who is a Data Analyst?
A Data Analyst is a problem-solver who turns raw, unstructured information into clear, actionable insights. They are the professionals behind the charts, dashboards, and data-driven strategies that guide modern business decisions. Think of them as data detectives — uncovering hidden stories buried within spreadsheets, databases, and cloud repositories.
At the heart of their role lies curiosity — the desire to understand why something happened, not just what happened. Data Analysts work extensively with structured data such as sales records, website traffic, customer feedback, or financial transactions. Using tools like SQL, Python, Excel, Power BI, and Tableau, they clean messy data, identify trends, and create visual narratives that help non-technical teams make sense of complex information.
But their job doesn’t stop at building dashboards. A skilled Data Analyst constantly collaborates with marketing, finance, product, and operations teams to translate numbers into strategies. For example, an analyst in an e-commerce firm might identify that customers who view product videos are 40% more likely to make a purchase — a simple but powerful insight that could redefine the company’s digital marketing strategy.
Ultimately, a Data Analyst’s success lies in transforming raw numbers into stories that influence decisions, drive performance, and create measurable business impact. They bridge the gap between data and decision-making, enabling organizations to optimize performance, reduce costs, and uncover new opportunities for growth.

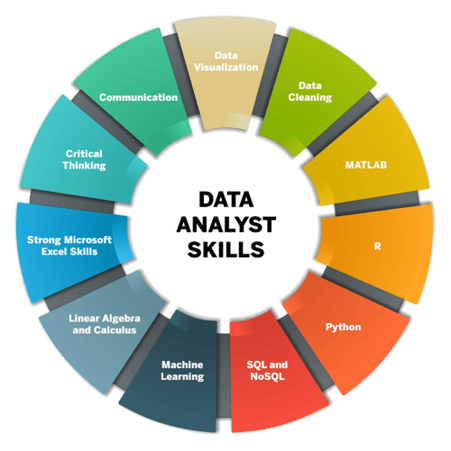
Skills
Strong analytical and statistical skills to interpret complex datasets.
Proficiency in SQL, Python, R, or Excel for data manipulation.
Knowledge of data visualization (Power BI, Tableau, Matplotlib, Seaborn).
Understanding of data cleaning, transformation, and modeling.
Ability to spot trends, patterns, and anomalies.
Basic understanding of business metrics and KPIs.
Key Responsibilities
Collect, clean, and organize data from multiple sources
Perform exploratory data analysis (EDA)
Create dashboards and reports to visualize insights
Identify patterns, correlations, and trends
Support business decisions with quantitative evidence
Example
A Data Analyst at a fintech company examines user transaction data to identify unusual spending patterns that may indicate fraud. By visualizing these trends in Power BI, they help risk teams act faster and prevent financial losses.
Typical Day of a Data Analyst
Morning: Pull daily performance data using SQL
Afternoon: Clean and prepare datasets using Python (Pandas, NumPy)
Evening: Build Power BI dashboards and present KPIs to the marketing or operations team
Common Tools and Platforms
Data Analysts rely on a variety of tools to collect, clean, analyze, and visualize data efficiently. These tools form the backbone of their daily workflow and allow them to transform raw data into meaningful business insights.
Programming & Data Handling:
Python (Pandas, NumPy, Matplotlib, Seaborn) for data cleaning, manipulation, and statistical analysis.
R for statistical modeling and hypothesis testing in research or academic environments.
Database Management:
SQL for querying, joining, and aggregating large datasets from relational databases such as MySQL, PostgreSQL, or Snowflake.
Google BigQuery and AWS Redshift for handling large-scale cloud-based data warehouses.
Visualization & Reporting:
Power BI and Tableau for interactive dashboards and business reports.
Excel for quick summaries, pivot tables, and ad-hoc data exploration.
Data Storage & Collaboration:
Google Sheets, Jupyter Notebooks, and GitHub for sharing analyses, dashboards, and code with teams.
Other Tools:
Google Analytics or Adobe Analytics for web and marketing data.
Excel VBA or Power Query for automation of repetitive data tasks.
These tools empower Data Analysts to extract value from vast data ecosystems — ensuring that organizations have the insights they need to improve efficiency, predict trends, and make smarter business decisions.
Sample SQL Query
SELECT region,
      SUM(revenue) AS total_revenue,
      COUNT(DISTINCT customer_id) AS customers
FROM sales_data
WHERE order_date BETWEEN '2025-01-01' AND '2025-10-01'
GROUP BY region
ORDER BY total_revenue DESC;
Python Example
import pandas as pd
df = pd.read_csv('sales_data.csv')
summary = df.groupby('region')['revenue'].sum().sort_values(ascending=False)
print(summary)
Who is a Business Analyst?
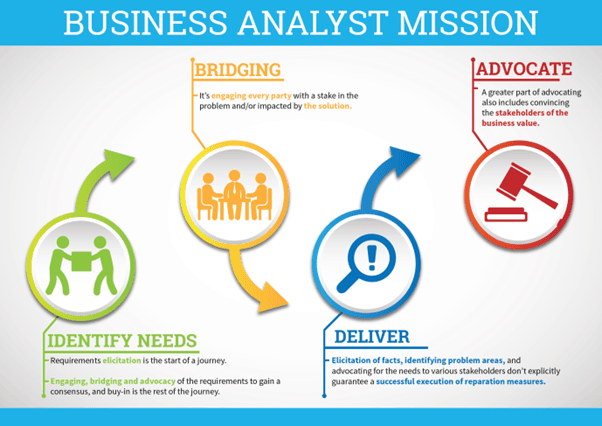
A Business Analyst (BA) is the strategic connector between data, people, and business outcomes. They translate complex analytical insights into meaningful business actions and ensure that every decision aligns with organizational goals. While Data Analysts uncover what’s happening through data, Business Analysts focus on what should be done next — making them the bridge between technical teams and decision-makers.
Unlike Data Analysts, who primarily handle numbers and code, Business Analysts dive deep into processes, workflows, and business objectives. Their role revolves around identifying business problems, defining requirements, and ensuring solutions deliver measurable impact. They work closely with stakeholders, product managers, and data teams to transform analytical findings into actionable roadmaps.
At their core, Business Analysts are strategic thinkers and communicators. They not only interpret dashboards and reports but also ask the right questions:
Why are sales declining in a specific region?
What business process can be optimized to save costs?
How can we align data insights with customer needs or company objectives?
For example, imagine a Business Analyst working at a retail company. The Data Analyst’s report shows that repeat purchases have dropped by 15%. The BA takes this data, investigates operational and marketing processes, and collaborates with cross-functional teams to design a customer retention plan — perhaps introducing loyalty programs, feedback loops, or targeted campaigns. Within months, customer retention improves, and the strategy proves its business value.
Ultimately, Business Analysts convert insights into impact. Their success isn’t just measured by numbers but by the real-world improvements they drive — higher efficiency, better customer satisfaction, and smarter resource allocation. They ensure that every technical solution solves a genuine business need, making them indispensable in data-driven organizations.
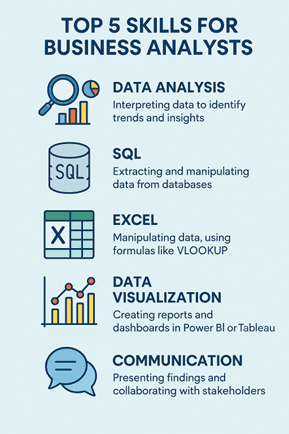
Skills
Strong business acumen and understanding of organizational processes.
Excellent communication and stakeholder management skills.
Ability to document requirements, workflows, and process gaps.
Analytical thinking for problem-solving and solution design.
Familiarity with basic data analysis to interpret reports and metrics.
Key Responsibilities
Gather and document business requirements from stakeholders
Define key performance indicators (KPIs) and success metrics
Analyze existing business processes and recommend improvements
Translate analytical data into actionable business strategies
Bridge communication between data, technical, and management teams
Example
A Business Analyst in a telecom company reviews churn data provided by Data Analysts. After identifying that most users leaving are from urban areas with network complaints, the BA collaborates with the operations and marketing teams to launch a targeted service-quality improvement plan. The result — reduced churn and increased customer loyalty.
Typical Day of a Business Analyst
Morning: Meet with stakeholders to define project goals and gather new business requirements
Afternoon: Analyze dashboards and performance reports shared by the analytics team
Evening: Draft a Business Requirement Document (BRD), prepare process improvement proposals, and present findings to management
Common Tools and Platforms
Documentation & Collaboration: JIRA, Confluence, Trello, Notion
Visualization & Reporting: Power BI, Tableau, Excel
Process Modeling: Lucidchart, Visio, Bizagi
Analytics Awareness: Basic SQL and Power BI to interpret trends
In Practice
Business Analysts play a critical role in ensuring data leads to decisions. While they may not write complex SQL queries, they know how to interpret analytical findings and align them with larger business objectives. Their ability to communicate insights clearly, manage stakeholders, and design data-informed strategies is what enables organizations to stay agile and competitive in fast-changing markets.
In short —
Data Analysts tell the story through numbers.
Business Analysts make that story count for the business.
Key Differences Between Data Analyst and Business Analyst
| Feature / Aspect | Data Analyst | Business Analyst |
|---|---|---|
| Primary Goal | Turn data into insights | Turn insights into decisions |
| Focus Area | Technical, analytical | Strategic, business process |
| Core Tools | SQL, Python, Excel, Power BI, Tableau | Excel, Power BI, JIRA, Confluence |
| Output | Dashboards, reports, visualizations | Strategies, recommendations, project plans |
| Communication | Within technical and analytics teams | Across business and management teams |
| Decision Level | Operational and tactical | Strategic and managerial |
| Performance Metric | Accuracy of insights | Business impact and ROI |
The Data Analyst ensures the story is data-backed, while the Business Analyst ensures it leads to measurable outcomes.
Soft Skills Requirement
Data Analyst
A Data Analyst thrives on numbers and patterns. They require:
Analytical mindset: Ability to break down complex problems and uncover insights from raw data.
Attention to detail: Ensures accuracy in datasets, reports, and dashboards.
Logical thinking: Connects data trends with real-world business scenarios.
Curiosity: Always questioning “why” something is happening and exploring deeper patterns.
Business Analyst
A Business Analyst focuses on bridging business needs and technical solutions. They require:
Communication: Clearly conveys requirements, findings, and solutions to stakeholders.
Negotiation: Balances competing priorities, expectations, and resources.
Stakeholder management: Builds relationships and ensures everyone is aligned.
Storytelling: Translates complex data or processes into compelling narratives for decision-making.
Real Example (E-Commerce Startup)
Imagine an e-commerce startup struggling with cart abandonment:
Data Analyst Role
Investigates customer behavior using transactional data.
Finds that a significant number of users leave the checkout process between 7–9 PM.
Identifies possible patterns: payment errors, slow page load, or confusing options.
Business Analyst Role
Works with UX designers, product managers, and operations teams.
Suggests improvements to the payment flow, such as simplifying steps, adding reminders, or offering multiple payment options.
Tests different approaches, monitors results, and ensures solutions align with business goals.
Outcome:
Cart abandonment decreases significantly.
Revenue increases due to smoother checkout experience.
Both roles complement each other: the Data Analyst uncovers the problem, and the Business Analyst implements the solution.
Real-World Use Cases Across Industries
In today’s data-driven world, businesses rely on the combined expertise of Data Analysts and Business Analysts to turn information into action. While Data Analysts uncover patterns, trends, and insights from raw data, Business Analysts translate these insights into practical strategies that drive business growth and efficiency. Here’s how their roles play out across different industries:
| Industry | Data Analyst’s Role | Business Analyst’s Role |
|---|---|---|
| E-commerce | Analyze product performance, customer segmentation, discount impact | Define pricing strategy, inventory planning, marketing campaigns |
| Healthcare | Study patient data, predict disease trends | Optimize hospital workflows, budget allocation |
| Finance | Build credit risk models, detect fraud | Recommend loan approval processes, improve risk policies |
| Telecom | Analyze churn and usage patterns | Suggest retention strategies, plan promotions |
| Education / EdTech | Measure learning outcomes | Improve curriculum or onboarding experience |
This synergy between Data Analysts and Business Analysts ensures that raw data and insights do not just sit in reports or dashboards. Instead, they are translated into actionable strategies, guiding business decisions, optimizing operations, improving customer experiences, and ultimately driving measurable growth across industries. Data Analysts identify what is happening and why, while Business Analysts turn those insights into practical solutions and strategic initiatives, creating a continuous loop of insight-driven business improvement.
Career Path, Growth, and Salaries
Both Data Analysts and Business Analysts are highly sought after across industries due to the increasing reliance on data-driven decision-making. While both roles involve analyzing information to support business outcomes, their career trajectories, skill sets, and growth opportunities differ, making each path unique.
| Role | Entry-Level | Mid-Level | Senior Roles | Salary Range (India) |
|---|---|---|---|---|
| Data Analyst | Junior Analyst | Senior Data Analyst / BI Analyst | Data Scientist / Analytics Manager | ₹5–12 LPA |
| Business Analyst | Associate BA | Senior BA / Product Analyst | Product Manager / Strategy Head | ₹6–14 LPA |
Global Perspective:
The demand for these roles is strong worldwide. In the U.S., Data Analysts earn an average of $70K–$100K per year, while Business Analysts typically earn $80K–$110K per year.
Both roles offer cross-domain mobility, allowing professionals to work in technology, finance, retail, healthcare, consulting, or even startups. Additionally, companies increasingly value hybrid skill sets — for example, Data Analysts with business acumen or Business Analysts with basic data analytics expertise can command premium roles globally.
Career Transitions:
Both roles provide excellent upward mobility:
Data Analyst: Can transition to Data Scientist, Analytics Manager, BI Lead, or even specialized roles in AI/ML.
Business Analyst: Can progress to Product Manager, Strategy Lead, Project Manager, or Operations Manager, depending on domain expertise.
These transitions often depend on acquiring new skills, gaining experience in strategic decision-making, and understanding broader business processes.
Certifications That Help:
Professional certifications can accelerate growth, enhance credibility, and increase earning potential:
For Data Analysts:
Google Data Analytics Certificate – Builds foundational skills in SQL, Excel, and visualization.
Microsoft Power BI Certification – Demonstrates mastery in creating dashboards and business intelligence reports.
AlmaBetter Data Science Program – Comprehensive program covering Python, SQL, statistics, and practical analytics projects.
For Business Analysts:
CBAP (Certified Business Analysis Professional) – Advanced certification for experienced BAs.
PMI-PBA (Professional in Business Analysis) – Focuses on business analysis in project environments.
AlmaBetter Business Analytics Program – Teaches analytics, reporting, SQL, and business strategy skills tailored for aspiring BAs.
Which Role is Right for You?
Still unsure which career path to choose? Both Data Analyst and Business Analyst roles are highly rewarding, but they focus on different skill sets and responsibilities. Choosing the right path depends on whether you enjoy working more with data and technical tools or business strategy and stakeholder interactions. Here’s a quick guide to help you decide:
| If You… | You’ll Love Being a… |
|---|---|
| Enjoy coding, statistics, and visualization | Data Analyst |
| Love understanding business goals and improving processes | Business Analyst |
| Prefer working with Python, SQL, and dashboards | Data Analyst |
| Prefer stakeholder communication and strategy meetings | Business Analyst |
| Want to transition into Data Science | Data Analyst |
| Want to move into Product Management | Business Analyst |
Tip:
Many professionals begin their careers as Data Analysts, where they develop strong analytical skills, work with databases, and master tools like Python, SQL, Excel, and BI platforms. Once confident in handling data, they often transition into Business Analyst or Product Analyst roles, leveraging their technical foundation to drive strategic business decisions. This combination of technical expertise and business acumen opens doors to senior roles, including Data Science, Product Management, and Analytics Leadership positions.
Conclusion
Data Analysts and Business Analysts may walk different paths, but they share a common mission — empowering organizations to make smarter, data-driven decisions.
The Data Analyst focuses on uncovering insights from raw data. They explore patterns, trends, and anomalies, applying statistical methods, coding, and visualization techniques to ensure that decisions are grounded in facts, evidence, and reliable predictions. Their work forms the foundation of informed decision-making, turning numbers into meaningful stories.
The Business Analyst, on the other hand, bridges the gap between data and action. They interpret the insights provided by Data Analysts and translate them into strategies, process improvements, and business solutions. By understanding organizational goals, stakeholder needs, and market dynamics, Business Analysts ensure that data-driven insights lead to tangible impact, growth, and innovation.
Both roles demand curiosity, analytical thinking, clear communication, and collaboration. While Data Analysts dive deep into numbers and algorithms, Business Analysts connect the dots between data and business strategy. Together, they are at the forefront of the analytics revolution, shaping industries worldwide and driving smarter, more efficient, and sustainable decision-making.
At AlmaBetter, we prepare you for both sides of the analytics spectrum.
Our Data Science and Business Analytics Programs blend technical mastery with strategic thinking — giving you hands-on experience through real-world projects, case studies, and mentorship from industry experts.
With pay-after-placement, placement guarantees, and a curriculum co-designed with leading companies, you’ll not just learn data — you’ll learn how to turn it into business impact.
Whether you dream of becoming a data wizard or a strategy expert, AlmaBetter is your gateway to a thriving analytics career.
Explore AlmaBetter’s Data Science and Analytics Programs
Additional Readings
How to Become a Data Analyst Without a Degree: This article provides insights into how individuals can pursue a career as a Data Analyst without a formal degree, emphasizing the importance of skills and practical experience.
Business Analyst Salary in India (Freshers to Experienced): While primarily focused on salary expectations, this article also touches upon the skills and qualifications that can influence a Business Analyst's earning potential in India.
Most Popular Big Data Analytics Tools in 2025: This article explores the top big data analytics tools that are gaining popularity in 2025, providing insights into the tools that Data Analysts should be familiar with.
20 Best Data Visualization Tools for 2025: Focusing on data visualization, this article lists the best tools available in 2025, which are essential for presenting data insights effectively.
How to Become a Data Scientist in 2025? A Complete Roadmap: While centered on Data Science, this article provides a comprehensive roadmap that can be beneficial for beginners looking to enter the data analytics field.
What is Tableau? Key Concepts, Features and Use Cases: This article delves into Tableau, a leading data visualization tool, and discusses how it can be used to create and interpret Key Performance Indicators (KPIs) and business metrics.
Defining Metrics and Alerts for ML Models: Although focused on machine learning models, this article provides valuable insights into defining metrics and setting alerts, which are crucial for monitoring business performance.


