


Data Science
Top Data Science Interview Questions and Answers (2025)
Last Updated: 25th August, 2025Explore essential data science interview questions and answers. Get ready to ace your data science job interview preparation with expert insights and tips.

Welcome to this interview preparation guide for data science positions. We will be exploring a range of topics and questions commonly encountered in data science interviews. Data science is a dynamic field that involves extracting insights and knowledge from data to drive informed decision-making. As a data science candidate, your ability to showcase your technical skills, problem-solving prowess, and domain knowledge is crucial during the interview process.
Throughout this data scientist interview questions guide, we will cover a variety of areas, including data manipulation, statistical analysis, machine learning, data visualization, data analysis interview questions and more. By the end of this article, you'll have a solid understanding of the types of questions you might face and how to approach answering them effectively.
Top 10 Most Asked Data Science Interview Questions
- What is Data Science?
- Differentiate between Data Analytics and Data Science
- What are the differences between supervised and unsupervised learning?
- Explain the steps in making a decision tree.
- Differentiate between univariate, bivariate, and multivariate analysis.
- How should you maintain a deployed model?
- What is a Confusion Matrix?
- How is logistic regression done?
- What is the significance of p-value?
- Mention some techniques used for sampling.
Data Science Interview Questions for Freshers
Now, we will delve into a selection of data science coding interview questions specifically designed for candidates who are new to the field and looking to start their careers in data science. Let's get started data science basic interview questions!
1. What is the difference between data analytics and data science?
Answer:
| Aspect | Data Analytics | Data Science |
|---|---|---|
| Purpose | Focuses on analyzing historical data for insights | Aims to extract insights, build models, and innovate |
| Approach | Works with existing data and hypotheses | Utilizes mathematical, statistical, and scientific tools |
| Focus | Present data analysis and interpretation | Addresses futuristic problems and predictive modeling |
| Tools and Methods | Uses fewer statistical and visualization tools | Utilizes a broad range of tools, algorithms, and techniques |
| Decision-making | Supports better decision-making based on history | Drives innovation and answers complex questions |
| Scope | Specific and concentrated problems | Broader and more comprehensive problem-solving |
| Timeframe | Focuses on present and past data | Incorporates historical, current, and future data |
| Insights Generation | Derives meaning from existing historical context | Builds connections and uncovers insights for the future |
2. What are some of the techniques used for sampling? What is the main advantage of sampling?
Answer:
Data analysis can not be done on a whole volume of data at a time especially when it involves larger datasets. It becomes crucial to take some data samples that can be used for representing the whole population and then perform analysis on it. While doing this, it is very much necessary to carefully take sample data out of the huge data that truly represents the entire dataset.
There are majorly two categories of sampling techniques based on the usage of statistics, they are:
- Probability Sampling techniques: Clustered sampling, Simple random sampling, Stratified sampling.
- Non-Probability Sampling techniques: Quota sampling, Convenience sampling, snowball sampling, etc.
3. What does it mean when the p-values are high and low?
Answer:
A p-value is the measure of the probability of having results equal to or more than the results achieved under a specific hypothesis assuming that the null hypothesis is correct. This represents the probability that the observed difference occurred randomly by chance.
- Low p-value which means values ≤ 0.05 means that the null hypothesis can be rejected and the data is unlikely with true null.
- High p-value, i.e values ≥ 0.05 indicates the strength in favor of the null hypothesis. It means that the data is like with true null.
- p-value = 0.05 means that the hypothesis can go either way.
4. Define the terms KPI, lift, model fitting, robustness and DOE.
Answer:
- KPI: KPI stands for Key Performance Indicator that measures how well the business achieves its objectives.
- Lift: This is a performance measure of the target model measured against a random choice model. Lift indicates how good the model is at prediction versus if there was no model.
- Model fitting: This indicates how well the model under consideration fits given observations.
- Robustness: This represents the system’s capability to handle differences and variances effectively.
- DOE: stands for the design of experiments, which represents the task design aiming to describe and explain information variation under hypothesized conditions to reflect variables.
5. Define and explain selection bias?
Answer:
The selection bias occurs in the case when the researcher has to make a decision on which participant to study. The selection bias is associated with those researches when the participant selection is not random. The selection bias is also called the selection effect. The selection bias is caused by as a result of the method of sample collection.
Four types of selection bias are explained below:
- Sampling Bias: As a result of a population that is not random at all, some members of a population have fewer chances of getting included than others, resulting in a biased sample. This causes a systematic error known as sampling bias.
- Time interval: Trials may be stopped early if we reach any extreme value but if all variables are similar invariance, the variables with the highest variance have a higher chance of achieving the extreme value.
- Data: It is when specific data is selected arbitrarily and the generally agreed criteria are not followed.
- Attrition: Attrition in this context means the loss of the participants. It is the discounting of those subjects that did not complete the trial.
6. Define bias-variance trade-off?
Answer: Let us first understand the meaning of bias and variance in detail:
Bias: It is a kind of error in a machine learning model when an ML Algorithm is oversimplified. When a model is trained, at that time it makes simplified assumptions so that it can easily understand the target function. Some algorithms that have low bias are Decision Trees, SVM, etc. On the other hand, logistic and linear regression algorithms are the ones with a high bias.
Variance: Variance is also a kind of error. It is introduced into an ML Model when an ML algorithm is made highly complex. This model also learns noise from the data set that is meant for training. It further performs badly on the test data set. This may lead to over lifting as well as high sensitivity.
When the complexity of a model is increased, a reduction in the error is seen. This is caused by the lower bias in the model. But, this does not happen always till we reach a particular point called the optimal point. After this point, if we keep on increasing the complexity of the model, it will be over lifted and will suffer from the problem of high variance.
We can represent bias variance trade off as:
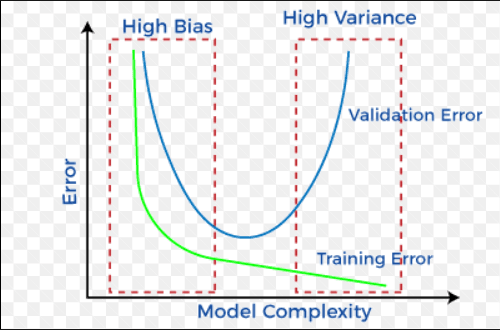
Bias Variance Trade off
7. What is logistic regression? State an example where you have recently used logistic regression.
Answer: Logistic Regression is also known as the logit model. It is a technique to predict the binary outcome from a linear combination of variables (called the predictor variables).
For example, let us say that we want to predict the outcome of elections for a particular political leader. So, we want to find out whether this leader is going to win the election or not. So, the result is binary i.e. win (1) or loss (0). However, the input is a combination of linear variables like the money spent on advertising, the past work done by the leader and the party, etc.
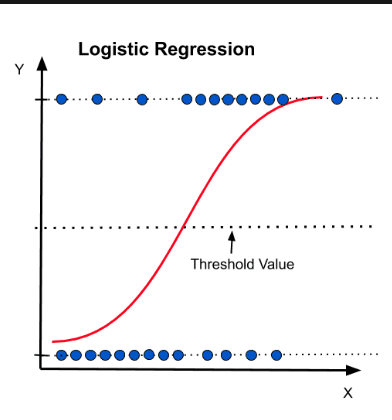
Logistic Regression
8. In a time interval of 15-minutes, the probability that you may see a shooting star or a bunch of them is 0.2. What is the percentage chance of you seeing at least one star shooting from the sky if you are under it for about an hour?
Answer:
Let us say that Prob is the probability that we may see a minimum of one shooting star in 15 minutes.
So, Prob = 0.2
Now, the probability that we may not see any shooting star in the time duration of 15 minutes is = 1 - Prob
1-0.2 = 0.8
The probability that we may not see any shooting star for an hour is:
= (1-Prob)(1-Prob)(1-Prob)*(1-Prob)
= 0.8 * 0.8 * 0.8 * 0.8 = (0.8)⁴
≈ 0.40
So, the probability that we will see one shooting star in the time interval of an hour is = 1-0.4 = 0.6
So, there are approximately 60% chances that we may see a shooting star in the time span of an hour.
9. Define the confusion matrix
Answer:
It is a matrix that has 2 rows and 2 columns. It has 4 outputs that a binary classifier provides to it. It is used to derive various measures like specificity, error rate, accuracy, precision, sensitivity, and recall. The test data set should contain the correct and predicted labels. The labels depend upon the performance. For instance, the predicted labels are the same if the binary classifier performs perfectly. Also, they match the part of observed labels in real-world scenarios. True Positive: This means that the positive prediction is correct.
- True Positive: This means that the positive prediction is correct.
- False Positive: This means that the positive prediction is incorrect.
- True Negative: This means that the negative prediction is correct.
- False Negative: This means that the negative prediction is incorrect.
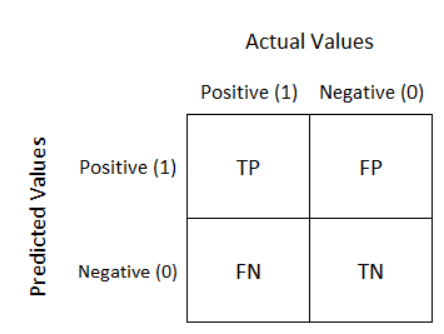
Confusion Matrix
10. What is a Gradient and Gradient Descent?
Answer:
Gradient: Gradient is the measure of a property that how much the output has changed with respect to a little change in the input. In other words, we can say that it is a measure of change in the weights with respect to the change in error. The gradient can be mathematically represented as the slope of a function.
Gradient Descent: Gradient descent is a minimization algorithm that minimizes the Activation function. Well, it can minimize any function given to it but it is usually provided with the activation function only.
Gradient descent, as the name suggests means descent or a decrease in something. The analogy of gradient descent is often taken as a person climbing down a hill/mountain. The following is the equation describing what gradient descent means:
So, if a person is climbing down the hill, the next position that the climber has to come to is denoted by “b” in this equation. Then, there is a minus sign because it denotes the minimization (as gradient descent is a minimization algorithm). The Gamma is called a waiting factor and the remaining term which is the Gradient term itself shows the direction of the steepest descent.
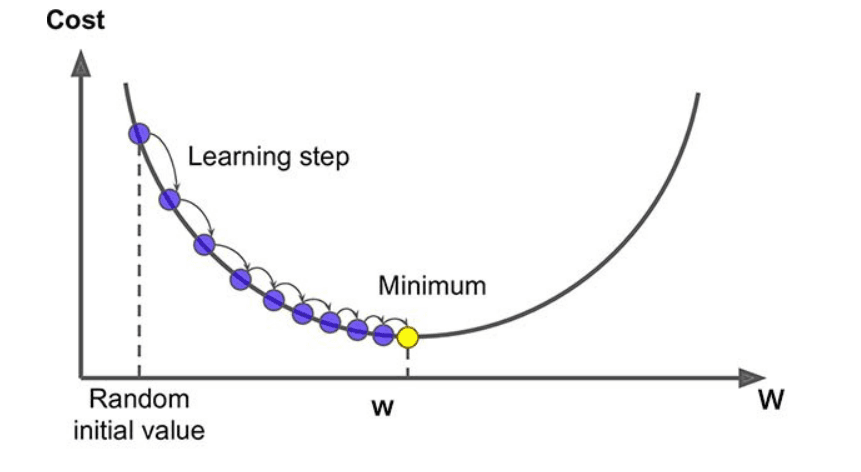
Gradient Descent
Data Science Interview Questions for Experienced
Here, we will delve into a set of interview questions on data science specifically crafted for candidates who possess significant experience in the field. Let's dive into the interview questions for data scientists!
1. How are the time series problems different from other regression problems?
Answer:
Time series data can be thought of as an extension to linear regression which uses terms like autocorrelation, movement of averages for summarizing historical data of y-axis variables for predicting a better future.
- Forecasting and prediction is the main goal of time series problems where accurate predictions can be made but sometimes the underlying reasons might not be known.
- Having Time in the problem does not necessarily mean it becomes a time series problem. There should be a relationship between target and time for a problem to become a time series problem.
- The observations close to one another in time are expected to be similar to the ones far away which provide accountability for seasonality. For instance, today’s weather would be similar to tomorrow’s weather but not similar to weather from 4 months from today. Hence, weather prediction based on past data becomes a time series problem.
2. So, you have done some projects in machine learning and data science and we see you are a bit experienced in the field. Let’s say your laptop’s RAM is only 4GB and you want to train your model on 10GB data set.What will you do? Have you experienced such an issue before?
Answer:
If I were faced with the situation of having a laptop with only 4GB of RAM and needing to train a model on a 10GB dataset, I would need to carefully consider several strategies to overcome this memory limitation. Here are a few approaches I might consider:
Data Sampling:
One of the simplest approaches is to sample a subset of the data for training. By selecting a representative sample, you can still train your model on a smaller scale while maintaining diversity in the data. However, this approach might lead to some loss of information and potentially less accurate results.
Feature Selection:
Evaluate the dataset's features and prioritize those that are most relevant to the task at hand. Removing less important or redundant features can help reduce the memory footprint and speed up training. Libraries like scikit-learn offer methods for feature selection.
Feature Engineering:
Transform and engineer new features from the existing ones. Sometimes, creating meaningful derived features can reduce the complexity of the data and improve model performance.
Incremental Learning:
Use incremental learning techniques to train the model in smaller batches. This involves dividing the data into chunks and training the model iteratively on each chunk. This approach is particularly useful for algorithms that support online learning.
Data Preprocessing:
Optimize data preprocessing steps to minimize memory usage. For example, consider loading only the required data columns into memory and saving intermediate results to disk instead of keeping them all in memory.
Cloud Computing:
Utilize cloud-based services with larger computing resources, such as Amazon Web Services (AWS) or Google Cloud, to perform the training. Cloud platforms offer scalable resources and memory capacity that can handle larger datasets.
Reducing Model Complexity:
Use simpler models that require fewer parameters, which can reduce memory requirements during training. For example, you might choose a linear model over a complex neural network.
Dimensionality Reduction:
Apply techniques like Principal Component Analysis (PCA) to reduce the dimensionality of the data. This can help retain important information while reducing memory usage.
Model Checkpointing:
Train the model in smaller segments and save checkpoints of the model's progress. This way, if the training process is interrupted due to memory limitations, you can resume training from the last checkpoint.
Transfer Learning:
Consider using pre-trained models for certain tasks and fine-tuning them with your specific data. Transfer learning can reduce the amount of training needed on your end.
Ultimately, the approach chosen would depend on the specific characteristics of the dataset, the machine learning task, and the resources available. It's important to carefully analyze the trade-offs between accuracy, memory usage, and computational time when making a decision.
3. What are Exploding Gradients and Vanishing Gradients?
Answer:
“Exploding gradients" and "vanishing gradients" are two related issues that can occur during the training of deep neural networks. These problems arise in the context of gradient-based optimization algorithms, such as gradient descent, which are used to update the weights of neural network layers during training. Let's explore both concepts:
- Exploding Gradients: Let us say that you are training an RNN. Say, you saw exponentially growing error gradients that accumulate, and as a result of this, very large updates are made to the neural network model weights. These exponentially growing error gradients that update the neural network weights to a great extent are called Exploding Gradients.
- Vanishing Gradients: Let us say again, that you are training an RNN. Say, the slope became too small. This problem of the slope becoming too small is called Vanishing Gradient. It causes a major increase in the training time and causes poor performance and extremely low accuracy.
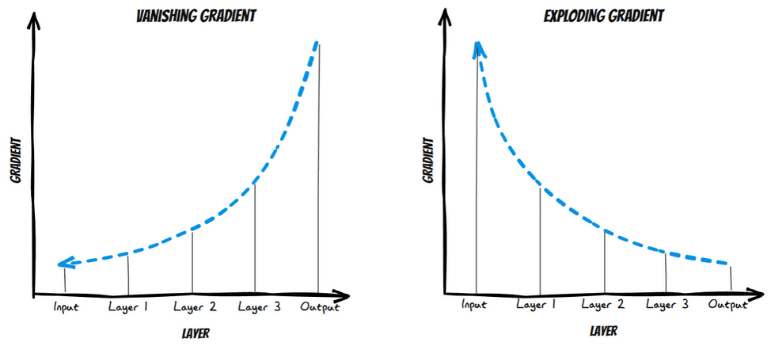
Vanishing Gradient and Exploding Gradient
4. Suppose there is a dataset having variables with missing values of more than 30%, how will you deal with such a dataset?
Answer:
Depending on the size of the dataset, we follow the below ways:
- In case the datasets are small, the missing values are substituted with the mean or average of the remaining data. In pandas, this can be done by using mean = df.mean() where df represents the pandas dataframe representing the dataset and mean() calculates the mean of the data. To substitute the missing values with the calculated mean, we can use df.fillna(mean).
- For larger datasets, the rows with missing values can be removed and the remaining data can be used for data prediction
5. How regularly must we update an algorithm in the field of machine learning?
Answer:
We do not want to update and make changes to an algorithm on a regular basis as an algorithm is a well-defined step procedure to solve any problem and if the steps keep on updating, it cannot be said well defined anymore. Also, this brings in a lot of problems to the systems already implementing the algorithm as it becomes difficult to bring in continuous and regular changes. So, we should update an algorithm only in any of the following cases:
- If you want the model to evolve as data streams through infrastructure, it is fair to make changes to an algorithm and update it accordingly.
- If the underlying data source is changing, it almost becomes necessary to update the algorithm accordingly.
- If there is a case of non-stationarity, we may update the algorithm.
- One of the most important reasons for updating any algorithm is its underperformance and lack of efficiency. So, if an algorithm lacks efficiency or underperforms it should be either replaced by some better algorithm or it must be updated.
6. Why is data cleaning crucial?
Answer:
While running an algorithm on any data, to gather proper insights, it is very much necessary to have correct and clean data that contains only relevant information. Dirty data most often results in poor or incorrect insights and predictions which can have damaging effects.
For example, while launching any big campaign to market a product, if our data analysis tells us to target a product that in reality has no demand and if the campaign is launched, it is bound to fail. This results in a loss of the company’s revenue. This is where the importance of having proper and clean data comes into the picture.
- Data Cleaning of the data coming from different sources helps in data transformation and results in the data where the data scientists can work on.
- Properly cleaned data increases the accuracy of the model and provides very good predictions.
- If the dataset is very large, then it becomes cumbersome to run data on it. The data cleanup step takes a lot of time (around 80% of the time) if the data is huge. It cannot be incorporated with running the model. Hence, cleaning data before running the model, results in increased speed and efficiency of the model.
- Data cleaning helps to identify and fix any structural issues in the data. It also helps in removing any duplicates and helps to maintain the consistency of the data.
7. During analysis, how do you treat the missing values?
Answer:
To identify the extent of missing values, we first have to identify the variables with the missing values. Let us say a pattern is identified. The analyst should now concentrate on them as it could lead to interesting and meaningful insights. However, if there are no patterns identified, we can substitute the missing values with the median or mean values or we can simply ignore the missing values.
If the variable is categorical, the common strategies for handling missing values include:
- Assigning a New Category: You can assign a new category, such as "Unknown" or "Other," to represent the missing values.
- Mode imputation: You can replace missing values with the mode, which represents the most frequent category in the variable.
- Using a Separate Category: If the missing values carry significant information, you can create a separate category to indicate missing values.
It's important to select an appropriate strategy based on the nature of the data and the potential impact on subsequent analysis or modelling.
If 80% of the values are missing for a particular variable, then we would drop the variable instead of treating the missing values.
8. Differentiate between box plot and histogram.
Answer:
Box plots and histograms are both visualizations used for showing data distributions for efficient communication of information.
Histograms are the bar chart representation of information that represents the frequency of numerical variable values that are useful in estimating probability distribution, variations and outliers.
Boxplots are used for communicating different aspects of data distribution where the shape of the distribution is not seen but still the insights can be gathered. These are useful for comparing multiple charts at the same time as they take less space when compared to histograms.
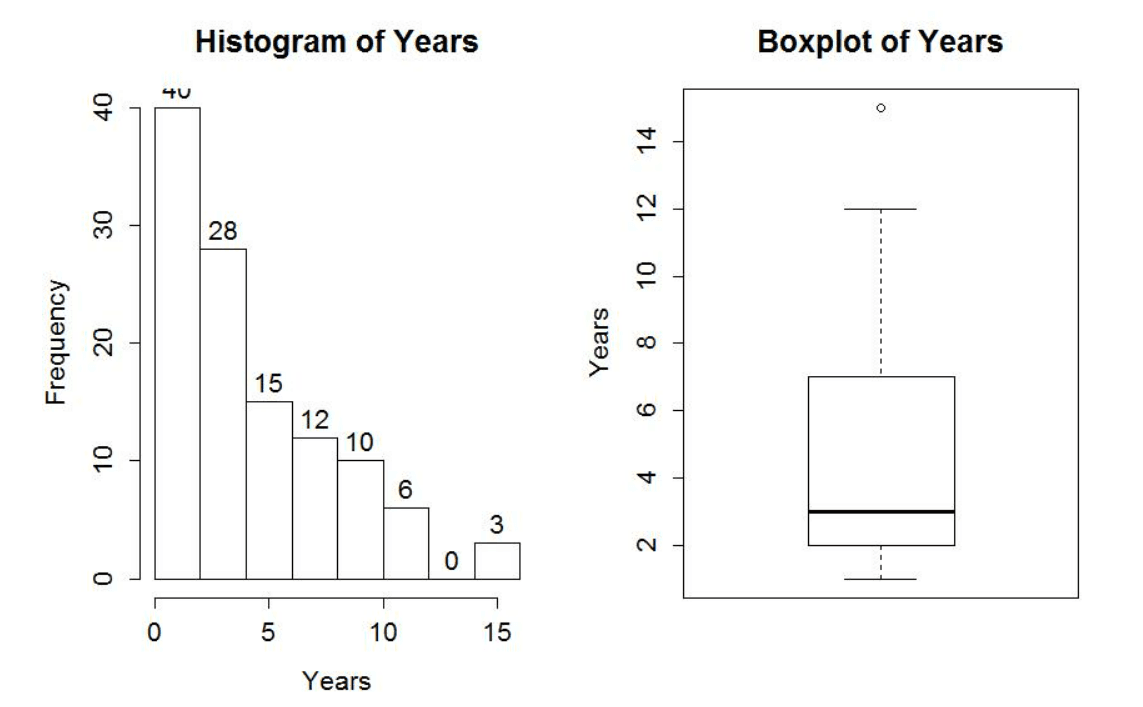
Histogram and Boxplot
9. How will you balance/correct imbalanced data?
Answer:
There are different techniques to correct/balance imbalanced data. It can be done by increasing the sample numbers for minority classes. The number of samples can be decreased for those classes with extremely high data points. Following are some approaches followed to balance data:
- Use the right evaluation metrics: In cases of imbalanced data, it is very important to use the right evaluation metrics that provide valuable information.
- Specificity/Precision: Indicates the number of selected instances that are relevant.
- Sensitivity: Indicates the number of relevant instances that are selected.
- F1 score: It represents the harmonic mean of precision and sensitivity.
- MCC (Matthews correlation coefficient): It represents the correlation coefficient between observed and predicted binary classifications.
- AUC (Area Under the Curve): This represents a relation between the true positive rates and false-positive rates.
For example, consider the below graph that illustrates training data:
Here, if we measure the accuracy of the model in terms of getting "0"s, then the accuracy of the model would be very high -> 99.9%, but the model does not guarantee any valuable information. In such cases, we can apply different evaluation metrics as stated above.
- Training Set Resampling: It is also possible to balance data by working on getting different datasets and this can be achieved by resampling. There are two approaches followed under-sampling that is used based on the use case and the requirements:
- Under-sampling This balances the data by reducing the size of the abundant class and is used when the data quantity is sufficient. By performing this, a new dataset that is balanced can be retrieved and this can be used for further modeling.
- Over-sampling This is used when data quantity is not sufficient. This method balances the dataset by trying to increase the samples size. Instead of getting rid of extra samples, new samples are generated and introduced by employing the methods of repetition, bootstrapping, etc.
- Perform K-fold cross-validation correctly: Cross-Validation needs to be applied properly while using over-sampling. The cross-validation should be done before over-sampling because if it is done later, then it would be like overfitting the model to get a specific result. To avoid this, resampling of data is done repeatedly with different ratios.
10. What are some examples when false positive has proven important than false negative?
Answer:
Before citing instances, let us understand what are false positives and false negatives.
- False Positives are those cases that were wrongly identified as an event even if they were not. They are called Type I errors.
- False Negatives are those cases that were wrongly identified as non-events despite being an event. They are called Type II errors.
Some examples where false positives were important than false negatives are:
- In the medical field: Consider that a lab report has predicted cancer to a patient even if he did not have cancer. This is an example of a false positive error. It is dangerous to start chemotherapy for that patient as he doesn’t have cancer as starting chemotherapy would lead to damage of healthy cells and might even actually lead to cancer.
- In the e-commerce field: Suppose a company decides to start a campaign where they give $100 gift vouchers for purchasing $10000 worth of items without any minimum purchase conditions. They assume it would result in at least 20% profit for items sold above $10000. What if the vouchers are given to the customers who haven’t purchased anything but have been mistakenly marked as those who purchased $10000 worth of products. This is the case of false-positive error.
11. How do you clean data?
Answer: Cleaning data is an essential step in the data preprocessing process, as it ensures that the data used for analysis or modeling is accurate, consistent, and reliable. Here are the general steps and techniques involved in cleaning data:
- Remove Duplicate Records: Check for and remove any duplicate rows or records in your dataset. Duplicates can skew analysis results and waste computational resources.
- Handle Missing Values: Deal with missing data, which can arise due to various reasons. Common strategies include:
- Removing rows or columns with too many missing values if they're not critical.
- Imputing missing values using statistical measures like mean, median, or mode.
- Predicting missing values using machine learning algorithms.
3. Correct Inaccurate Values: Identify and correct data points that are clearly inaccurate or erroneous. This might involve cross-referencing with external sources or applying domain knowledge.
4. Standardize Data Formats: Ensure consistent formats for data, such as date formats, units of measurement, and categorical values. Inconsistent formatting can lead to misinterpretation.
5. Remove Outliers: Identify and handle outliers—data points that significantly deviate from the rest of the dataset. Depending on the context, outliers can be removed, transformed, or kept based on domain knowledge.
Handle Inconsistent Categorical Data: If categorical data has multiple representations (e.g., "Male," "M," "M "), standardize them to a single representation. Also, consider merging or grouping categories if they're similar.
6. Validate Data Integrity: Check for referential integrity, where relationships between tables or datasets are maintained properly.
7. Check for Typos and Errors: Scrutinize the data for common typos, spelling mistakes, and data entry errors. Regular expressions or automated scripts can help with this.
8. Ensure Data Conformity: Ensure that data adheres to predefined rules or constraints. For example, check that age values are within reasonable ranges.
Validate Data Against Domain Knowledge: Validate the data against your domain knowledge and business rules to identify any anomalies or inconsistencies.
9. Explore Visualizations: Visualize the data using plots, histograms, and other visualizations to identify patterns, anomalies, or odd distributions.
10. Document Changes: Keep a record of the changes you make during data cleaning, as this can help others understand the preprocessing steps taken.
Data cleaning is a iterative process, and you might need to revisit these steps as you analyze or model the data. The specific techniques you use will depend on the nature of your dataset and the goals of your analysis or modeling.
Frequently Asked Data Science Interview Questions
1. Explain the steps in making a decision tree.
Answer: Creating a decision tree involves a series of steps to build a predictive model that makes decisions based on input features. Decision trees are a popular machine learning algorithm used for both classification and regression tasks. Here's a step-by-step breakdown of how to construct a decision tree:
- Decision Tree Construction:
- The decision tree is constructed recursively. The process starts with the entire dataset at the root node.
- Calculate a measure of impurity for the target variable in the current dataset (e.g., Gini impurity, entropy for classification; mean squared error for regression).
- Determine the best attribute to split the dataset based on a splitting criterion (e.g., information gain, Gini gain, gain ratio).
- Create a new internal node (representing a decision) based on the chosen attribute.
- Partition the dataset into subsets based on the attribute's values and assign each subset to a child node.
- Recursion (Subtree Construction):
- For each child node, repeat the process of calculating impurity and finding the best attribute to split the data again.
- Continue this process recursively for each child node until a stopping condition is met. This condition could be reaching a certain depth, achieving a minimum number of samples per leaf, or other criteria.
- Stopping Conditions:
- To prevent overfitting, incorporate stopping conditions that determine when to stop growing the tree. Overfitting occurs when the tree becomes too complex and captures noise in the data.
- Common stopping conditions include limiting the tree's depth, setting a minimum number of samples required to split a node, and requiring a minimum improvement in impurity measures for splits.
- Leaf Node Assignments:
- When a stopping condition is met, create a leaf node (terminal node) and assign it the majority class (for classification) or the mean/median value (for regression) of the target variable in that leaf.
- Pruning (Optional):
- Pruning involves removing branches of the tree that do not provide significant improvements in predictive performance on a validation set.
- Pruning helps reduce overfitting and simplifies the final tree.
- Tree Visualization:
- Visualize the decision tree to better understand its structure and decision-making process. Each node represents a decision based on an attribute, and each leaf node represents the predicted outcome.
- Model Evaluation:
- Evaluate the performance of the decision tree model on the testing/validation set using appropriate metrics (accuracy, F1-score, mean squared error, etc.).
- Adjust hyperparameters, such as maximum depth and minimum samples per leaf, to optimize the model's performance.
2. How do you build a random forest model?
Answer:
A random forest is built up of a number of decision trees. If you split the data into different packages and make a decision tree in each of the different groups of data, the random forest brings all those trees together.
Steps to build a random forest model:
- Randomly select 'k' features from a total of 'm' features where k << m
- Among the 'k' features, calculate the node D using the best split point
- Split the node into daughter nodes using the best split
- Repeat steps two and three until leaf nodes are finalized
- Build forest by repeating steps one to four for 'n' times to create 'n' number of trees
3. How should you maintain a deployed model?
Answer: The steps to maintain a deployed model are:
- Monitor
Constant monitoring of all models is needed to determine their performance accuracy. When you change something, you want to figure out how your changes are going to affect things. This needs to be monitored to ensure it's doing what it's supposed to do.
- Evaluate
Evaluation metrics of the current model are calculated to determine if a new algorithm is needed.
- Compare
The new models are compared to each other to determine which model performs the best.
- Rebuild
The best-performing model is re-built on the current state of data.
4. How can outlier values be treated?
Answer: You can drop outliers only if it is a garbage value.
Example: height of an adult = abc ft. This cannot be true, as the height cannot be a string value. In this case, outliers can be removed.
If the outliers have extreme values, they can be removed. For example, if all the data points are clustered between zero to 10, but one point lies at 100, then we can remove this point.
If you cannot drop outliers, you can try the following:
- Try a different model. Data detected as outliers by linear models can be fit by nonlinear models. Therefore, be sure you are choosing the correct model.
- Try normalizing the data. This way, the extreme data points are pulled to a similar range.
- You can use algorithms that are less affected by outliers; an example would be random forest.
5. ‘People who bought this also bought…' recommendations seen on Amazon are a result of which algorithm?
Answer:
The recommendation engine is accomplished with collaborative filtering. Collaborative filtering explains the behavior of other users and their purchase history in terms of ratings, selection, etc.
The engine makes predictions on what might interest a person based on the preferences of other users. In this algorithm, item features are unknown.
For example, a sales page shows that a certain number of people buy a new phone and also buy tempered glass at the same time. Next time, when a person buys a phone, he or she may see a recommendation to buy tempered glass as well.
6. What do you understand about true positive rate and false-positive rate?
Answer:
True Positive Rate (TPR) defines the probability that an actual positive will turn out to be positive.
The True Positive Rate (TPR) is calculated by taking the ratio of the [True Positives (TP)] and [True Positive (TP) & False Negatives (FN) ].
The formula for the same is stated below -
TPR=TP/TP+FN
False Positive Rate (FPR) defines the probability that an actual negative result will be shown as a positive one i.e the probability that a model will generate a false alarm.
The False Positive Rate (FPR) is calculated by taking the ratio of the [False Positives (FP)] and [True Positives (TP) & False Positives(FP)].
The formula for the same is stated below -
FPR=FP/TN+FP
7. What is deep learning?
Answer:
Deep learning is a subfield of machine learning that focuses on the development and use of neural networks to solve complex problems. Neural networks are computational models inspired by the structure and function of the human brain's interconnected neurons. Deep learning involves training these neural networks on large amounts of data to learn patterns and representations that can be used for tasks such as image and speech recognition, natural language processing, and more.
The term "deep" in deep learning refers to the depth of the neural networks, which are composed of multiple layers of interconnected nodes or neurons. Each layer transforms the data it receives and passes it to the next layer, with the final layer producing the desired output. The process of training a deep neural network involves adjusting the weights and biases of the network's connections using optimization algorithms, so that the network can learn to make accurate predictions or classifications.
8. Which of the following machine learning algorithms can be used for inputting missing values of both categorical and continuous variables?
Answer:
- K-means clustering
- Linear regression
- K-NN (k-nearest neighbor)
- Decision trees
The K nearest neighbor algorithm can be used because it can compute the nearest neighbor and if it doesn't have a value, it just computes the nearest neighbor based on all the other features.
When you're dealing with K-means clustering or linear regression, you need to do that in your pre-processing, otherwise, they'll crash. Decision trees also have the same problem, although there is some variance.
9. How can you select k for k-means?
Answer:
We use the elbow method to select k for k-means clustering. The idea of the elbow method is to run k-means clustering on the data set where 'k' is the number of clusters.
Within the sum of squares (WSS), it is defined as the sum of the squared distance between each member of the cluster and its centroid.
10. What are recommender systems?
Answer:
A recommender system predicts what a user would rate a specific product based on their preferences. It can be split into two different areas:
- Collaborative Filtering
As an example, Last.fm recommends tracks that other users with similar interests play often. This is also commonly seen on Amazon after making a purchase; customers may notice the following message accompanied by product recommendations: "Users who bought this also bought…"
- Content-based Filtering
As an example: Pandora uses the properties of a song to recommend music with similar properties. Here, we look at content, instead of looking at who else is listening to music.
Conclusion
In conclusion, preparing for data science technical interview questions is crucial to stand out and demonstrate your expertise in this dynamic and evolving field. The questions typically cover a wide range of topics, from fundamental concepts to practical applications. By mastering the essential concepts such as data science processes, machine learning techniques, data handling strategies, and problem-solving approaches, you can confidently tackle a variety of questions that may arise during your interviews.
Remember that while technical knowledge is essential, interviewers are also interested in how you think critically, approach real-world problems, and communicate your solutions effectively. Practicing your answers, working through case studies, and discussing your thought processes out loud can help you refine your responses and showcase your analytical skills.
Furthermore, tailoring your preparation to the specific company and role you're applying for can give you a competitive edge. Researching the company's projects, industry focus, and the specific skills they're looking for will allow you to address their needs more directly in your responses.
Ultimately, an interview is an opportunity to demonstrate your passion for data science, your ability to handle complex challenges, and your potential as a valuable contributor to a data-driven organization. By thoroughly preparing for a range of data science interview questions, you can enter your interviews with confidence and increase your chances of success.
If you are interested in mastering all the Data science concepts in detail to ace your interviews with ease and land your dream job - Do look out for our free Data Science Tutorial and Full Stack Data Science Course.
Related Articles
Top Tutorials

Made with in Bengaluru, India


- Courses
- Advanced Certification in Data Analytics & Gen AI Engineering
- Advanced Certification in Web Development & Gen AI Engineering
- MS in Computer Science: Machine Learning and Artificial Intelligence
- MS in Computer Science: Cloud Computing with AI System Design
- Professional Fellowship in Data Science and Agentic AI Engineering
- Professional Fellowship in Software Engineering with AI and DevOps
- Join AlmaBetter
- Sign Up
- Become A Coach
- Coach Login
- Policies
- Privacy Statement
- Terms of Use
- Contact Us
- admissions@almabetter.com
- 08046008400
- Official Address
- 4th floor, 133/2, Janardhan Towers, Residency Road, Bengaluru, Karnataka, 560025
- Communication Address
- Follow Us

© 2025 AlmaBetter